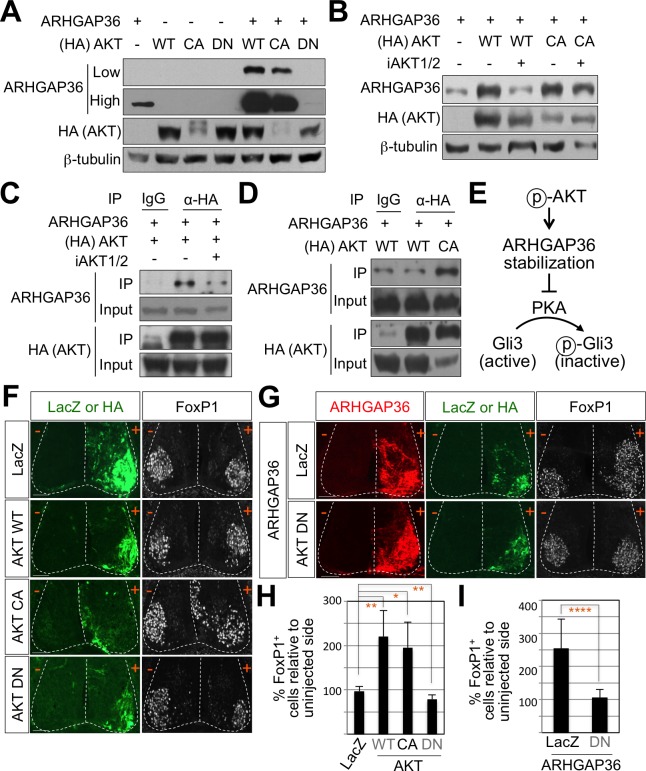
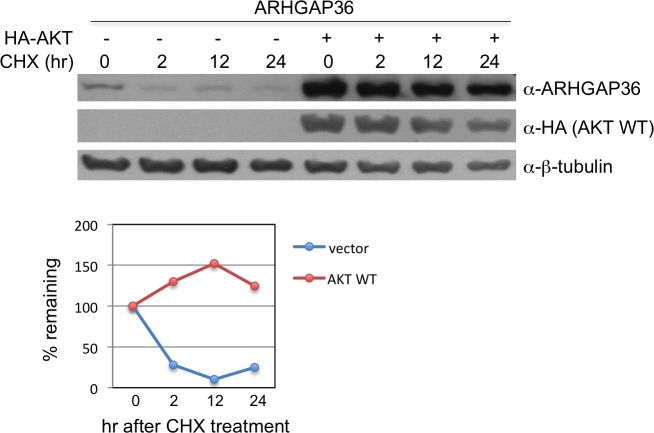
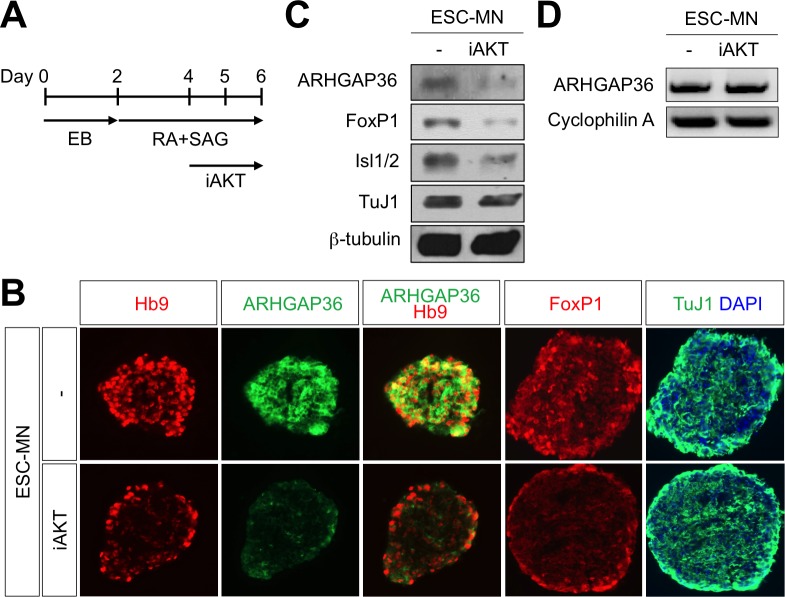
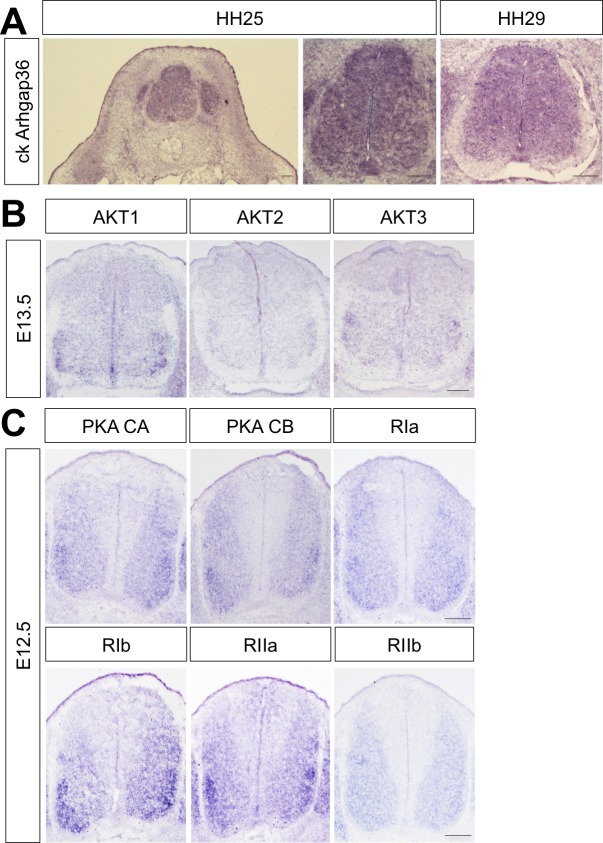
Figure 7. AKT potentiates Shh signaling through stabilization of ARHGAP36 proteins and AKT-ARHGAP36 axis is required for LMC specification.
(A) ARHGAP36 was stabilized dramatically by AKT WT and CA, but not by DN in HEK293T cells. ARHGAP36 was transiently transfected with AKT constructs in HEK293T cells and the protein levels were monitored by western blotting. β-tubulin was used as a loading control. (B) 10 μM of AKT inhibitor (iAKT1/2) was treated for 20 hr and the protein level of ARHGAP36 was monitored. AKT inhibitor reversed the effect of AKT WT in stabilizing ARHGAP36 protein but had no effect on constitutively active form of AKT. (C) Co-immunoprecipitation assay with HEK293T cells transiently transfected with the expression vectors for HA-tagged AKT and ARHGAP36 showed that AKT WT co-purified ARHGAP36, and this interaction was decreased by iAKT1/2, the AKT inhibitor. (D) The CA form of AKT interacted with ARHGAP36 more robustly than AKT WT. ARHGAP36 with either HA-tagged AKT WT or AKT CA was transfected into HEK293T cells and immunoprecipitated with anti-HA antibody that pull-downs AKT. Anti-IgG antibody was used as a negative control. (E) Illustration of the modulatory pathway showing that activated AKT stabilizes ARHGAP36 proteins, which in turn blocks the kinase activity of PKA, which results in Gli-dependent transcriptional activation via dephosphorylation of Gli. (F) IHC analyses in the chick neural tube electroporated with AKT WT, CA and DN. Embryos (n = 8–10) were harvested 4dpe. AKT WT or CA increased the number of FoxP1+ cells by almost two fold in the electroporated side (+) compared to the non-electroporated control side (-). Experiments were repeated independently at least three times. Scale bars: 100 μm. (G) The analysis of ectopic FoxP1+ neuron formation by ARHGAP36 in the presence of either AKT DN or LacZ in the chick neural tube. Embryos (n = 8–10) were harvested 4dpe. +, electroporated side; -, non-electroporated control side. AKT DN completely blocked the effect of ARHGAP36 in inducing ectopic FoxP1 expression in the electroporated cells. Experiments were repeated independently at least three times. Scale bars: 100 μm. (H,I) Quantification of the number of FoxP1+ neurons on the electroporated (+) and non-electroporated (-) sides of the spinal cord. Data are mean ± s.d. *p<0.01, **p<0.001, ****p<0.00001 (Student’s t-test). n = 6 ~ 27 independent images per each sample.


