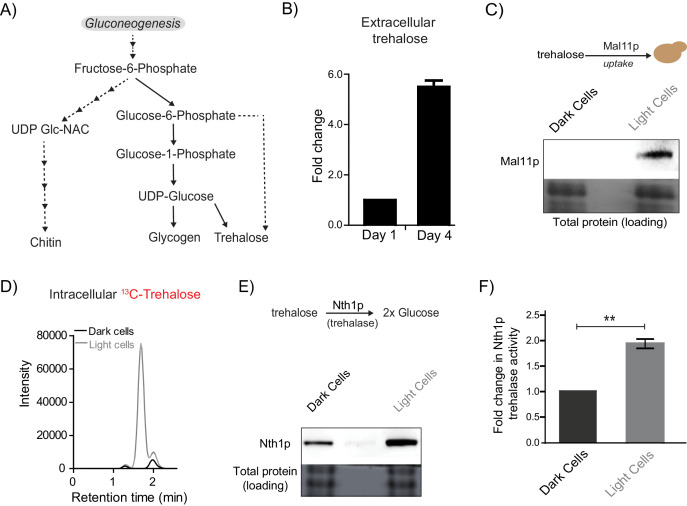
Figure 4. Trehalose satisfies criteria to be the metabolic resource determining the emergence of light cells.
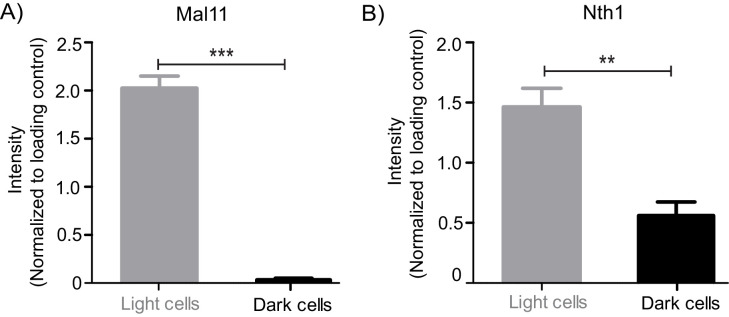
(A) A schematic illustrating the metabolic intermediates and different end-point metabolites of gluconeogenesis. (B) Extracellular amounts of trehalose measured from developing wild-type colonies. Entire colonies were isolated, and only exogenous trehalose estimated, at the respective days. Fold change in the amount of extracellular trehalose produced by a 4 day old colony with respect to a 1 day old colony was calculated (n = 3). (C) Comparative protein amounts of Mal11, a major transporter of trehalose in S. cerevisiae, in light and dark cells, as measured using a Western blot is shown. The blot is representative of 3 independent experiments (n = 3). (D) Estimates of the relative ability of light and dark cells to uptake trehalose is shown. 13C Trehalose was exogenously added to light and dark cells, and intracellular amounts of the same are shown (as intensity of the MS/MS peak corresponding to 13C-trehalose) (n = 3). (E) Comparative amounts of Nth1, the major intracellular trehalase enzyme in S. cerevisiae, in light and dark cells, as measured using a Western blot is shown. The blot is representative of 3 independent experiments (n = 3). (F) in vitro neutral trehalase activity present in lysed light or dark cells is shown (n = 3). Statistical significance was calculated using unpaired t test (** indicates p<0.01) and error bars represent standard deviation.


