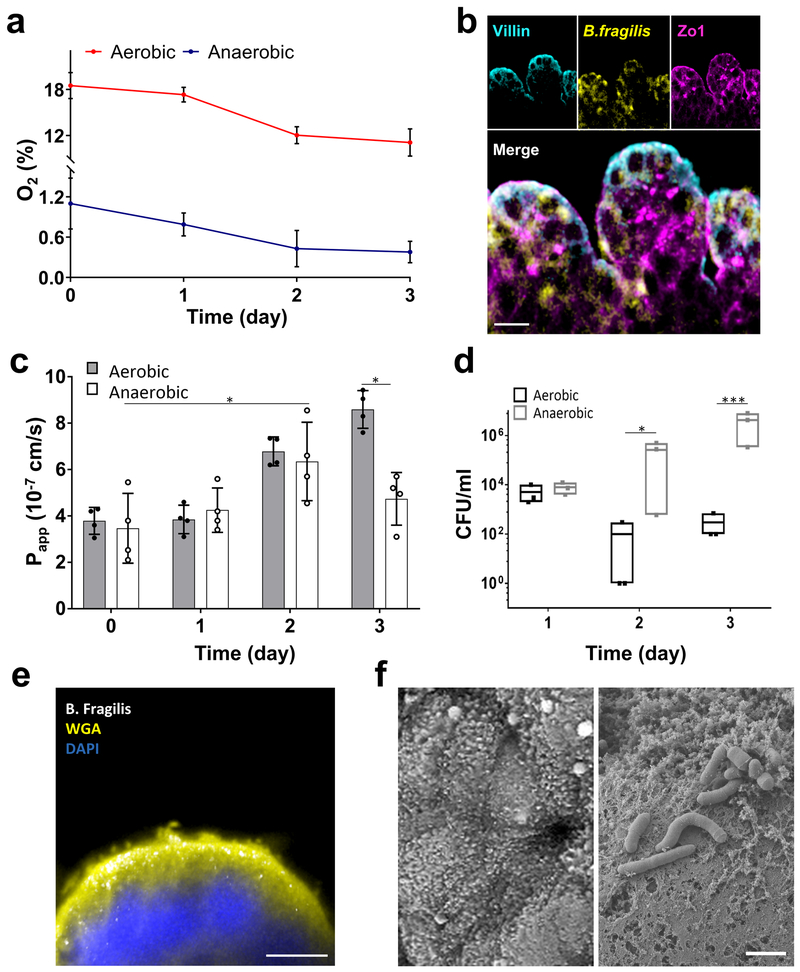
Fig. 2 ∣. Co-culture of human intestinal epithelium and obligate anaerobe, Bacteroides fragilis, on-chip.
a, Oxygen concentration profiles in aerobic and anaerobic Intestine Chips co-cultured with Bacteroides fragilis (n=4 individual chips; data are presented as mean ± s.d.). b, Representative vertical cross-sectional, confocal micrographic views through the intestinal epithelium-microbiome interface within the Intestine Chip cultured under anaerobic conditions, when immunostained for villin (cyan), ZO-1 (magenta) and nuclei with DAPI (blue). (scale bar, 50 μm; B. fragilis was HADA (yellow) labelled; representative images from 4 intestine chips are shown). c, Changes in apparent paracellular permeability (Papp) measured by quantitating cascade blue transport across the tissue-tissue interface within the Intestine Chip microdevices co-cultured with Bacteroides fragilis under aerobic and anaerobic conditions (n=4 individual chips; data are presented as mean ± s.d.; significance was calculated by one-way analysis of variance; *P = 0.042 and 0.033 for anaerobic day 2 vs. day 0 and aerobic vs. anaerobic day 3, respectively). d, CFU counts/mL of Bacteroides fragilis co-cultured in the Intestine Chip under aerobic and anaerobic conditions (n=3 individual chips; data are presented as mean ± s.d.; significance was calculated by one-way analysis of variance; *P = 0.031 for day 2 and ***P<0.001 for day 3). e, Cross-sectional fluorescence microscopic view of the Caco2 epithelium (nuclei stained in blue with DAPI), overlying mucus layer stained with Alexa Fluor 488-conjugated WGA (yellow), and B. fragilis bacteria (GalCCP labelled, white) when co-cultured in the Intestine Chip. Scale bar, 10 μm. f, SEM views of the apical surface of the Caco2 epithelium in the Intestine Chip comparing the morphology on day 4 of culture before it accumulates a mucus layer and when the surface microvilli are visible (top) versus when Bacteroides fragilis have been added on day 12 after the mucus layer has accumulated, which can be seen as a dense mat that separates the bacteria from the epithelial cell surface (bottom). Scale bar, 2 μm.

