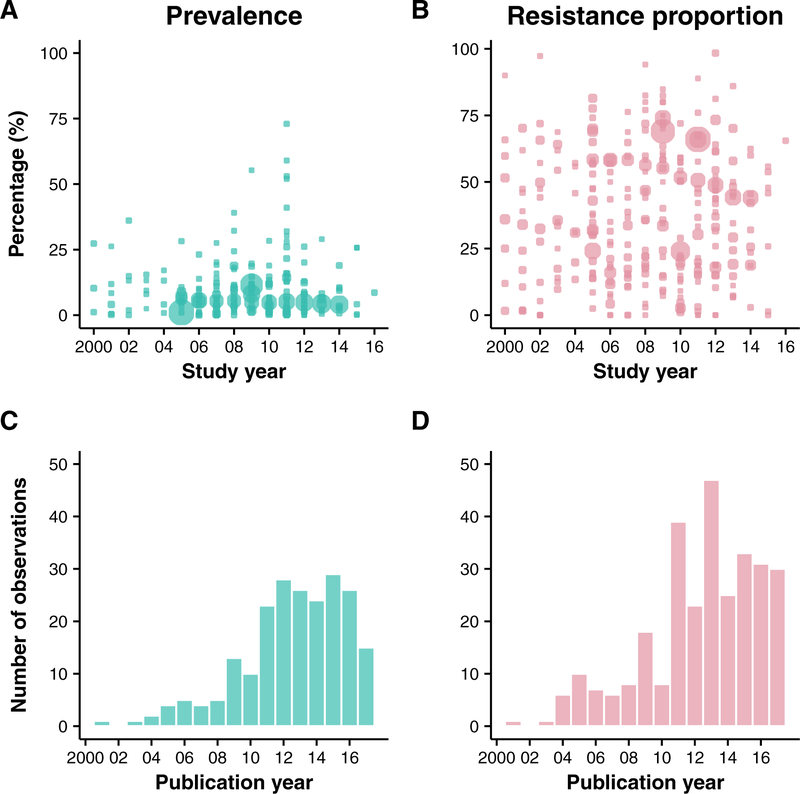
Figure 3. MRSA prevalence and resistance proportions reported in Asia Pacific by year of publication.
Panel A. MRSA prevalence, defined as the proportion of MRSA among all tested samples, reported in selected countries between year 2000 and 2016. For studies that report prevalence for more than one year, the midpoint of the study is reported as the study year. Bubble sizes reflect the study sample size for each observation. Panel B. MRSA resistance proportion, defined as as the proportion of MRSA among all S. aureus isolates, reported in selected countries between year 2000 and 2016. For studies that report prevalence for more than one year, the midpoint of the study is reported as the study year. Bubble sizes reflect the study sample size for each observation. Panel C. Number of publications that report MRSA prevalence in selected countries in year 2000 – 2017. Panel D. Number of publications that report MRSA prevalence in selected countries in year 2000 – 2017.

