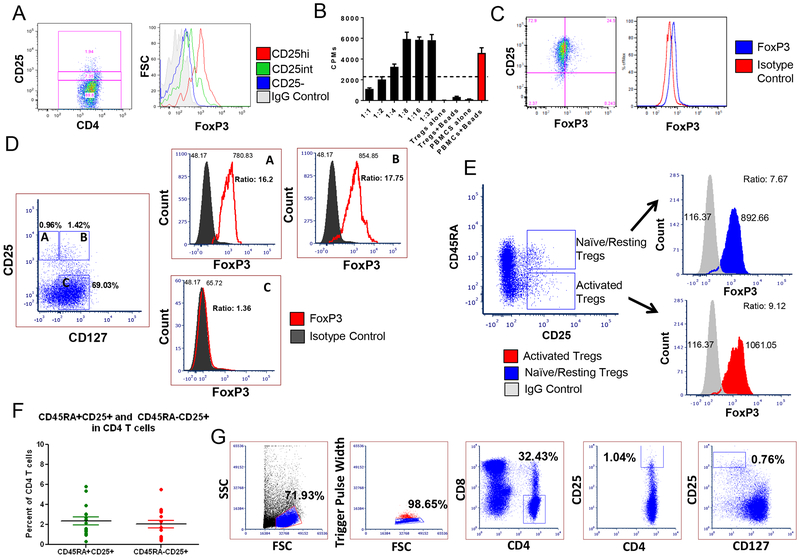
Figure 1. Phenotype and function of Cynomolgus macaque Tregs.
(A) FoxP3 levels based on CD25 expression in CD4+ T cells. (B) In vitro suppression of anti-CD2CD3CD28 bead-stimulated autologous-PBMCs by freshly isolated CD4+CD25hi Tregs. (C) FoxP3 expression of CD3+CD4+CD25low/negative sorted T cells after seven days of incubation with anti-CD2CD3CD28 beads. (D) FoxP3 expression in relation to CD25 and CD127 in unstimulated PBMCs (representative figure of n=4). (E) Analysis of FoxP3 expression in naïve/resting and activated Tregs in whole blood. (F) Average number of Tregs within the blood based on the expression of CD25 and CD45RA (n=16). (G) Sorting schema for the MCM Tregs.

