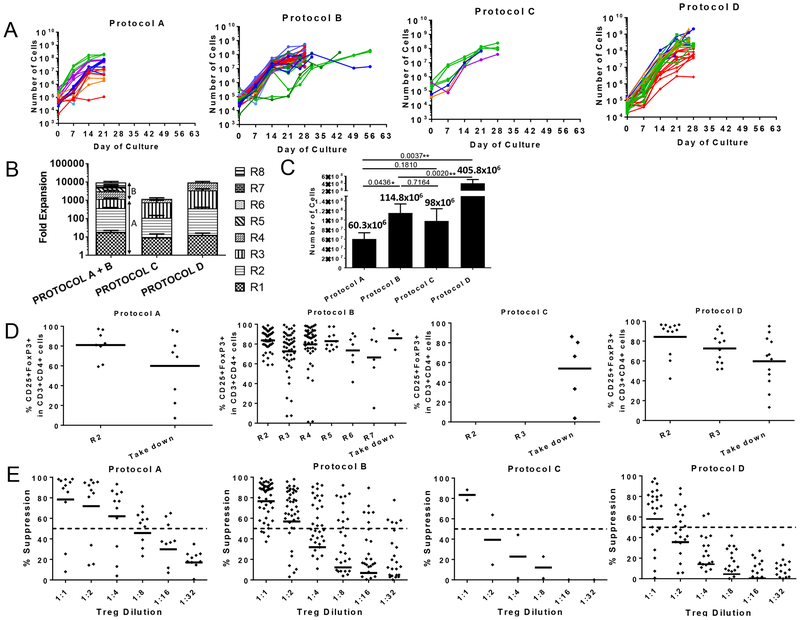
Figure 2. Expansion, suppression and phenotype of Tregs grown under four different conditions.
(A) Growth curves of Tregs cultured under four different protocols over time. Each color represents a different animal. (B) Average fold-expansion in each restimulation. Protocols A and B are identical during the first 21 days, and are therefore combined until day 21. “R” is indicative of the number of restimulations. (C) Average yield of Tregs obtained at the end of each protocol. (D) Expression of FoxP3 among CD3+CD4+CD25hi cells for each protocol. “R” is indicative of the number of restimulations. Each dot represents a different Treg line for each restimulation. (E) Suppressive function of Tregs for each expansion protocol. Suppression was measured by the ability to prevent the proliferation of anti-CD2CD3CD28 bead-stimulated-PBMCs. The dashed line denotes 50% suppression. Each dot at every dilution represents a different Treg line. Phenotype and function were tested in most (but not all) restimulations. With the exception of R4 in protocols C and D on day 26, restimulations occurred every seven days.

