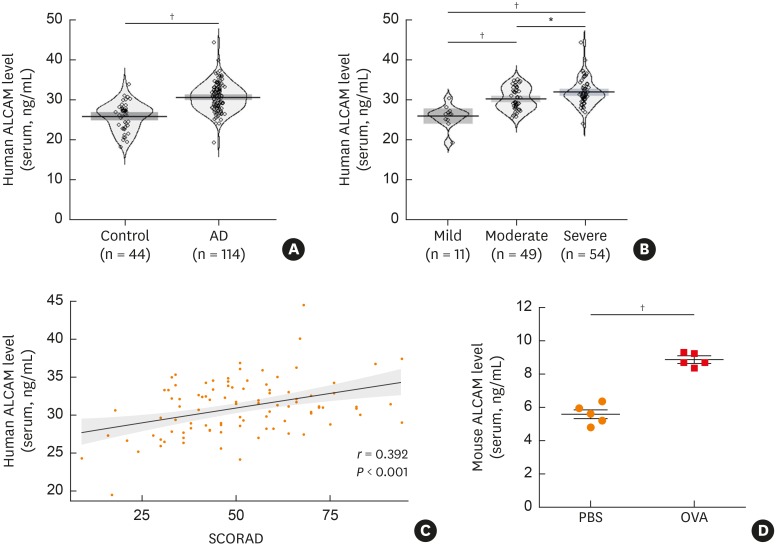
Fig. 1. ALCAM expression in pediatric AD patients and OVA-induced AD mice. (A-C) ALCAM level was measured by ELISA in serum samples from healthy controls (n = 44) and AD patients (n = 114). Pirate plots show the distribution of ALCAM levels for each group; horizontal lines represent means and boxes represent 95% confidence intervals. (A) ALCAM level in human serum. (B) Increase in serum ALCAM level as a function of AD severity increases. (C) Correlation between serum ALCAM level and AD SCORAD index. (D) Serum ALCAM abundance was assessed by ELISA.
The data represent mean ± standard error of the mean.
ALCAM, activated leukocyte cell adhesion molecule; AD, atopic dermatitis; OVA, ovalbumin; PBS, phosphate-buffered saline; SCORAD, SCORing atopic dermatitis; ELISA, enzyme-linked immunosorbent assay.
*P < 0.05; †P < 0.001 by t-test (n = 5–10 mice/group).

