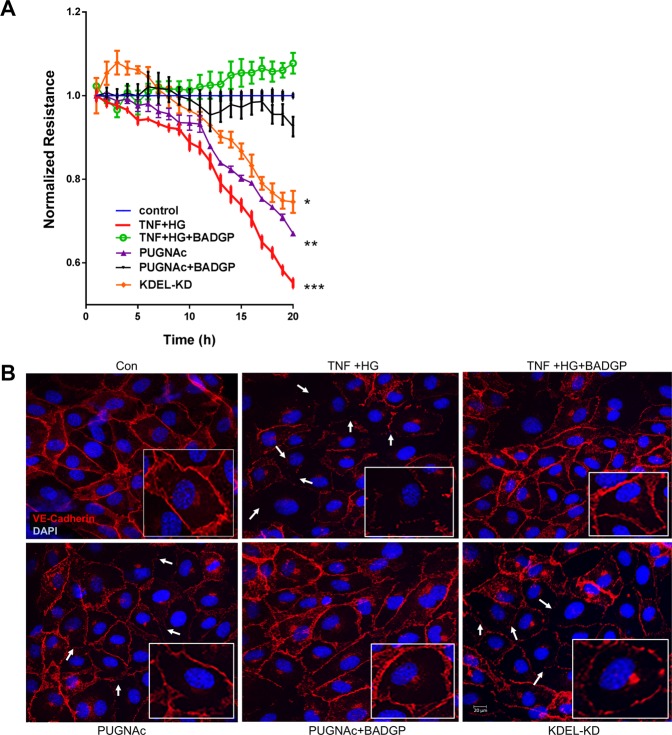
Figure 5.
HRECs exposed to TNF-α, and high glucose for 24 h demonstrated decreased trans-endothelial electrical resistance. Representative ECIS tracings plotted as normalized resistance from all treatment groups (A). Representative confocal immunofluorescence images of the cells stained for VE-Cadherin. Boxed images shows higher magnification. White arrows indicate loss of cell-cell contacts (B). Data represent Mean ± SEM from 3 independent experiments performed in duplicates. **p < 0.01; *p < 0.05 compared to controls. Scale bar = 20 μm.

