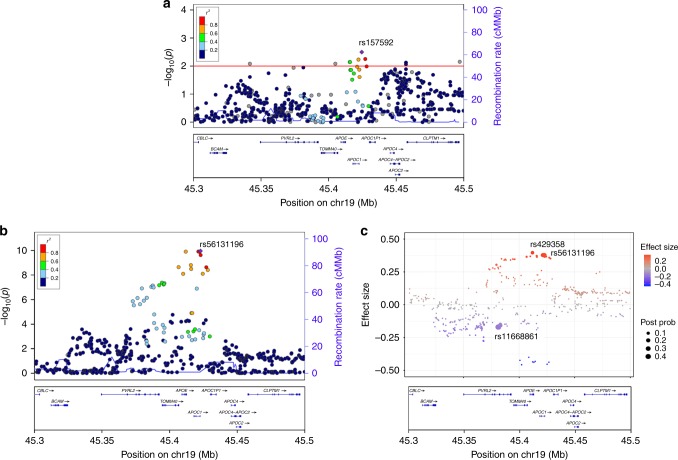
Fig. 1.
Multivariant effects of the APOE locus in the Chinese AD cohort. a Regional association plot of the AD risk variants in APOE-ε3 homozygous subjects. The horizontal red line denotes the p-value threshold of 0.01. b Regional association plot of the AD risk variants (SNPs and INDELs with frequency ≥ 5%) located in the APOE locus. The purple diamond specifies the sentinel variant (with the SNP ID marked in the plot). Dot colors illustrate the LD (measured as R2) between the sentinel variant and its neighboring variants. c CAVIAR analysis results for mapping of possible causal variants in the APOE locus. Dots represent the variants tested in the APOE locus; the y-axis and dot color denote the effect size. Dot size corresponds to the posterior probabilities of the variants being the causal variants obtained from CAVIAR analysis, with the sentinel variants located in three loci marked with SNP IDs. AD Alzheimer’s disease, CAVIAR causal variants identification in associated regions, cM/Mb centimorgans per megabase, INDELs insertions and deletions, LD linkage disequilibrium, SNP single nucleotide polymorphism, Post Prob posterior probabilities of being the causal variants

