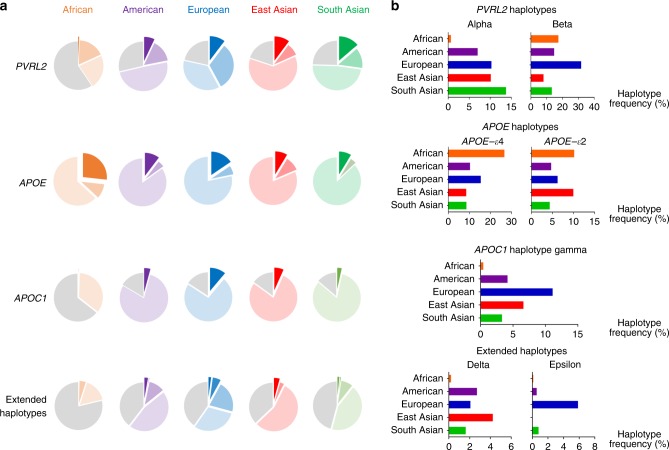
Fig. 7.
Heterogeneity of the prevalence of risk haplotypes in APOE and the surrounding region among populations. Data were derived from the 1000 Genomes phase 3 whole-genome sequencing dataset (n = 2504, comprising 661 African, 347 American, 503 European, 504 East Asian, and 489 South Asian genomes). a Major and minor haplotypes among populations. The proportions of minor haplotypes are shown as exploded areas in dark colors; areas with light colors denote the proportions of major haplotypes (i.e., the most frequent ones), and gray areas indicate the proportions of all other haplotypes for the corresponding locus. Exploded areas denote the phenotype-associated minor haplotypes for comparison across ethnic groups, with detailed frequencies shown in the right panel. b Frequencies of minor haplotypes across different ethnic groups, with the x-axis denoting the haplotype frequencies across super-populations

