Fig. 2.
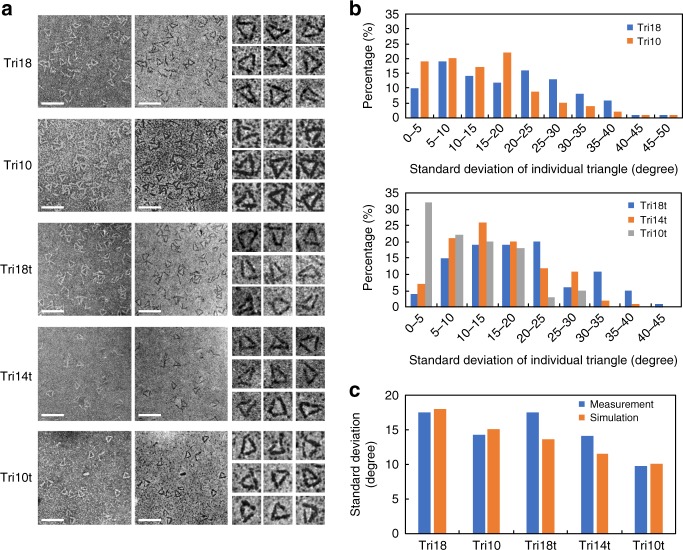
Construction of protein triangles and optimization of vertex linker lengths. a STEM images of protein triangles. The images in the left column are bright-field overview images of the triangles, the images in the middle column are dark-field overview images of the same triangles, and the images in the right column are magnified dark-field images of individual triangles. Scale bars, 50 nm. Magnified images, 25 nm × 25 nm. b Histograms displaying the standard deviations of the three vertex angles within each individual triangle for the five triangular nanostructures made in this study using full length (above) and truncated (below) 3HB constructs (n = 100 triangles for each structure). c Standard deviations of all individual vertex angles in each of the five constructed triangles from STEM image measurements and computational simulations (n = 100 triangles for each structure). Source data are provided as a Source Data file

