Fig. 3.
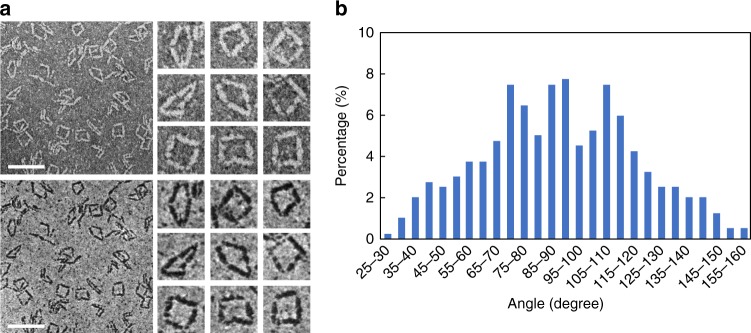
Construction of protein squares and their angle distributions. a Bright-field (top) and dark-field (bottom) STEM images of the protein squares, with individual squares magnified on the right. Scale bars, 50 nm. Magnified images, 25 nm × 25 nm. b Experimental distribution of angles measured in the square nanostructures (n = 400, with four angles measured from each of 100 squares). Source data are provided as a Source Data file

