Fig. 4.
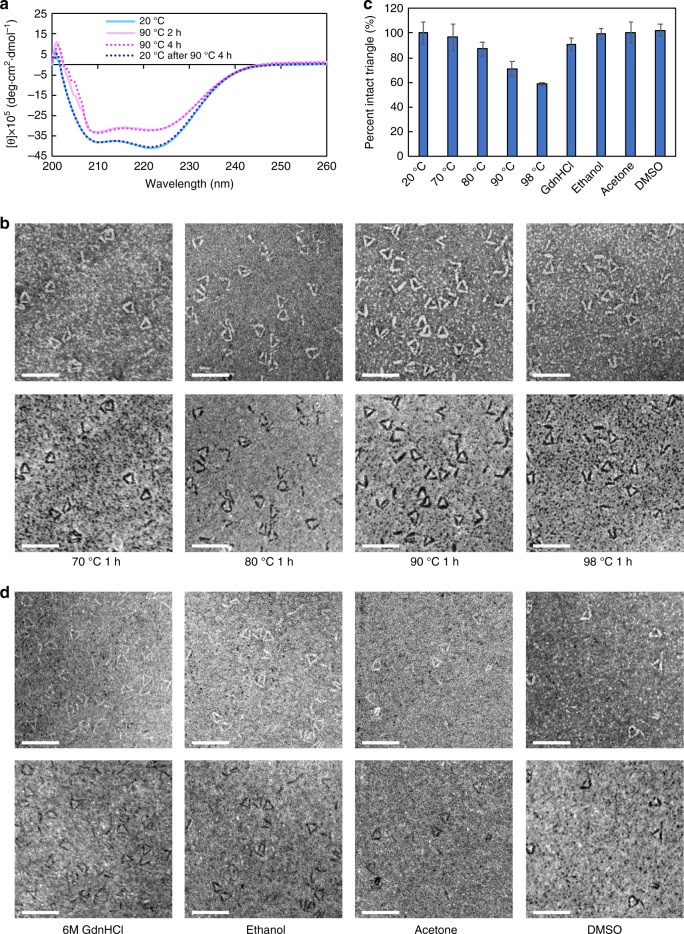
Thermal and chemical stability of the protein triangles. a CD spectra of the Tri10t sample incubated at 20 and 90 °C. b Bright-field (top) and dark-field (bottom) STEM images of protein triangles after 1 h incubation at different temperatures. Scale bars, 50 nm. c Percentages of 3HB copies contained in intact triangular nanostructures after incubation in different conditions, normalized by pre-incubation values. Error bars represent the s.d. (n = 3 denaturation experiment replicates). d Bright-field (top) and dark-field (bottom) STEM images of the protein triangles after incubation in chaotropic and organic solvents. Scale bars, 50 nm. Source data are provided as a Source Data file

