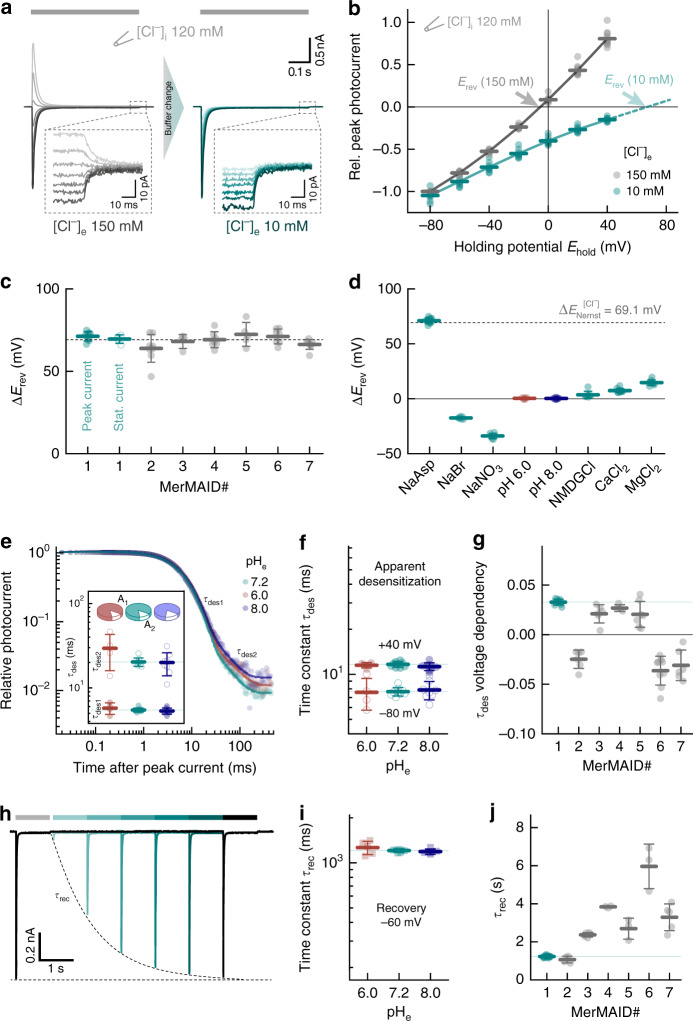
Fig. 2.
Ion selectivity and kinetic properties of MerMAIDs a Representative photocurrent traces of MerMAID1 elicited with 500 nm light (gray bar) at different membrane potentials (−80 to +40 mV, in 20 mV steps, from bottom to top) before (left, gray) and after extracellular chloride reduction (right, cyan), as indicated. Insets show enlarged views of the remaining stationary photocurrent. b Current-voltage relationship of the MerMAID1 peak photocurrent at 150 mM (gray) and 10 mM (cyan) extracellular chloride ([Cl−]e). Arrows indicate reversal potentials (Erev). c Reversal potential shifts (ΔErev) upon reduction of [Cl−]e for peak currents of all MerMAIDs as well as the stationary current of MerMAID1. d ΔErev values of MerMAID1 upon exchange of external buffer. ΔErev of the theoretical Nernst potential for Cl− is indicated as a dashed line (c, d). e Extracellular pH (pHe) dependence of biphasic MerMAID1 desensitization kinetic. Inset shows the time constants and their relative amplitudes to total decay. f pHe dependency of the apparent desensitization time constant (τdes) at −80 and +40 mV. g Voltage dependency of τdes for all MerMAIDs in ms/mV. h Double-light pulse experiment at −60 mV and pHe 7.2 to determine the peak current recovery time constant (τrec). i pHe dependency of MerMAID1 at −60 mV. j Recovery time constants of all MerMAID variants. Mean values (thick lines) ± standard deviation (whiskers) are shown, and single-measurement data points are represented as dots. Source data are provided as a Source Data file (b–d, e–g, i, and j)

