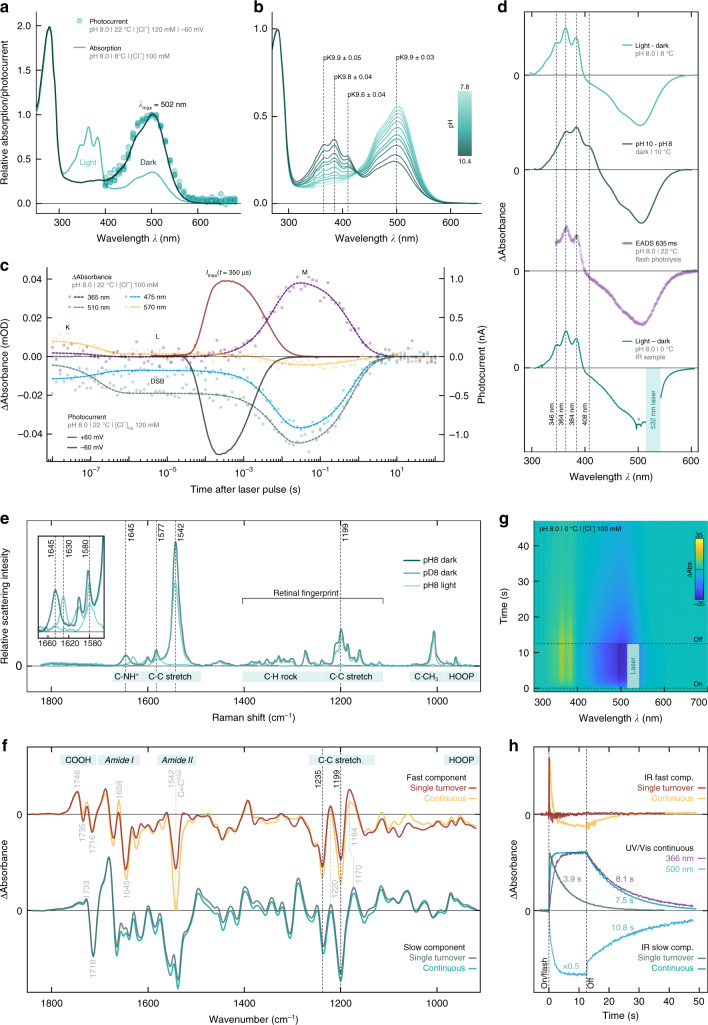
Fig. 3.
Spectroscopic characterization of purified MerMAID1. a Normalized UV/vis absorption spectra of dark-adapted and illuminated MerMAID1. Filled circles indicate single-measurement action spectra recordings, as shown in Fig. 1f. b Normalized UV/vis absorption spectra of MerMAID1 at different pH values, titrated from pH 7.8 to 10.4. The pK values for specific wavelengths are indicated. c Transient absorption changes and electrophysiological recordings obtained with single-turnover laser pulse excitation. d Fine-structured difference absorption spectra obtained from different experiments. (From top to bottom) light minus dark difference spectra obtained from data shown in a, pH-difference spectra calculated from panel b data, evolution-associated difference spectra (EADS) resulting from a global fit of the transient absorption spectra and (bottom) light-minus-dark difference spectrum measured using the FTIR sample shown in g. Due to strong laser scattering, a portion of the spectral data is excluded for the FTIR sample, and residual scattering is marked with an asterisk. e Resonance Raman spectra of dark-adapted MerMAID1 at pH/D 8 (recorded at 488 nm) as well as cryo-trapped and illuminated protein sample at pH 8 (recorded at 413 nm). Inset: zoomed C=NH+ stretching region. f Kinetically decomposed FTIR light-minus-dark absorption of MerMAID1, recorded with single turnover and continuous illumination at 0 °C. Bands marked in gray are discussed in the Supplementary Discussion g, Contour plot of transient absorption changes of the sample used in f illuminated with a 532 nm continuous laser. h Kinetics of the fast and slow FTIR components obtained under single-turnover and continuous illumination conditions, respectively. Kinetics at 366 and 500 nm obtained from the UV/vis spectroscopic measurements shown in g are shown for comparison

