Fig. 3.
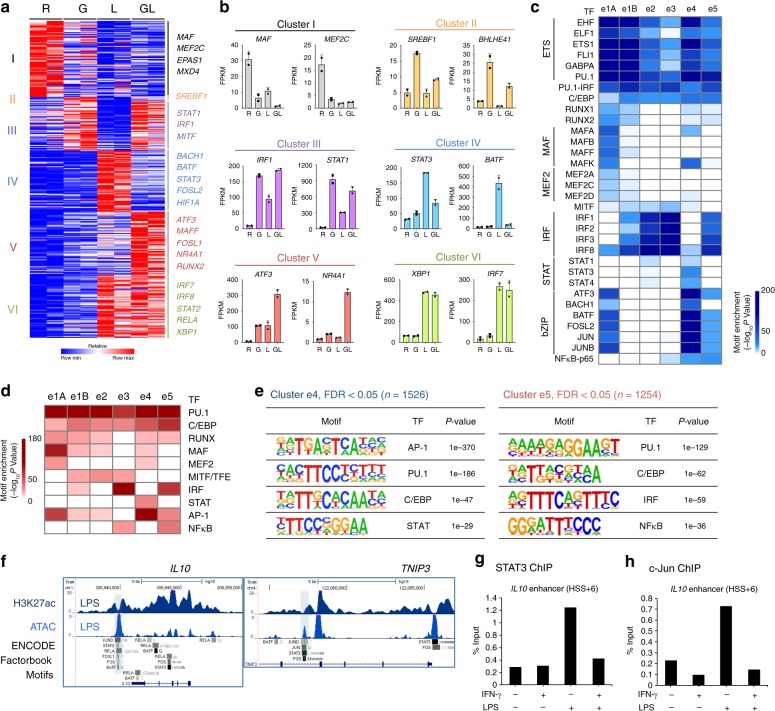
TF expression and binding motif enrichment in distinct enhancer subsets. a Heatmap of gene expression of 91 transcription factors in the clusters defined in Fig. 1a. b Examples of TF gene expression from the six identified clusters identified in a. c Heatmap showing the P-value significance of known motif enrichment in each cluster (defined as in Fig. 2a) and grouped according to TF families (left). d Heatmap showing the P-value significance of de novo motif enrichment in six enhancer clusters. e The most significantly enriched transcription factor (TF) motifs identified by de novo motif analysis using HOMER in cluster e4 (left) and cluster e5 (right) enhancers. f UCSC Genome Browser tracks showing normalized tag density of H3K27ac ChIP-seq and ATAC-seq in LPS-stimulated macrophages. Cumulative TF binding at each e4 enhancer from ENCODE project (Factorbook) is shown below the gene tracks. Boxes enclose representative e4 enhancers at IL10 (left) and TNIP3 (right) locus. g ChIP-qPCR of STAT3 at the e4 enhancer (HSS + 6) of IL10. h ChIP-qPCR of c-Jun at the e4 enhancer (HSS + 6) of IL10. Data depict experiments with two different donors (a) or are representative of two (b–f) or three (g, h) independent experiments

