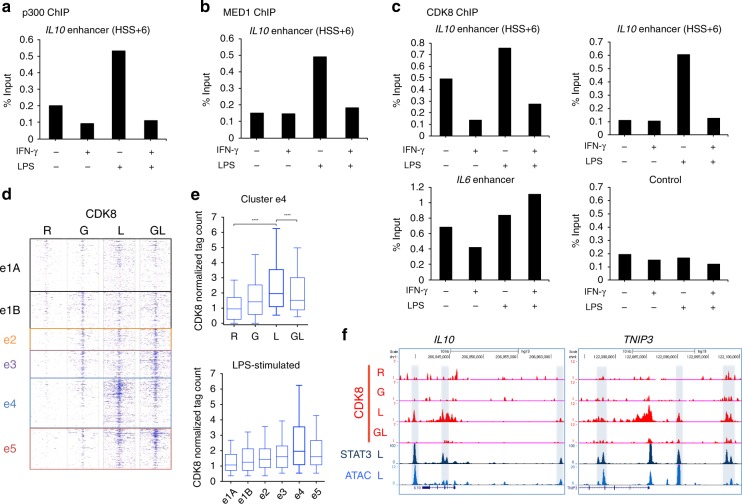
Fig. 5.
IFN-γ suppresses coactivator and CDK8 recruitment to e4 enhancers. a ChIP-qPCR analysis of p300 occupancy at the e4 enhancer (HSS + 6) of IL10. b ChIP-qPCR analysis of MED1 occupancy at the e4 enhancer (HSS + 6) of IL10. c ChIP-qPCR analysis of CDK8 occupancy at e4 enhancers (HSS + 6 and HSS-16) of IL10 and e5 enhancer of IL6. d Heatmap showing CDK8 ChIP-seq signals at each enhancer cluster defined in Fig. 2a. e The boxplot (top) indicates normalized tag counts at e4 enhancer in the four indicated conditions. ****p < 0.0001, paired-samples Wilcoxon signed-rank test. The boxplot (bottom) indicates normalized tag counts at each enhancer cluster in LPS-stimulated macrophages. Boxes encompass the twenty-fifth to seventy-fifth percentile changes. Whiskers extend to the tenth and ninetieth percentiles. The central horizontal bar indicates the median. f Representative UCSC Genome Browser tracks displaying normalized tag-density profiles at e4 enhancers of IL10 and TNIP3 in the four indicated conditions (CDK8) and the LPS-stimulated condition (STAT3 ChIP-seq and ATAC-seq). Data are representative of three independent experiments (a–c), or depict one ChIP experiment using pooled samples from independent experiments using four different donors (d, e)

