Fig. 6.
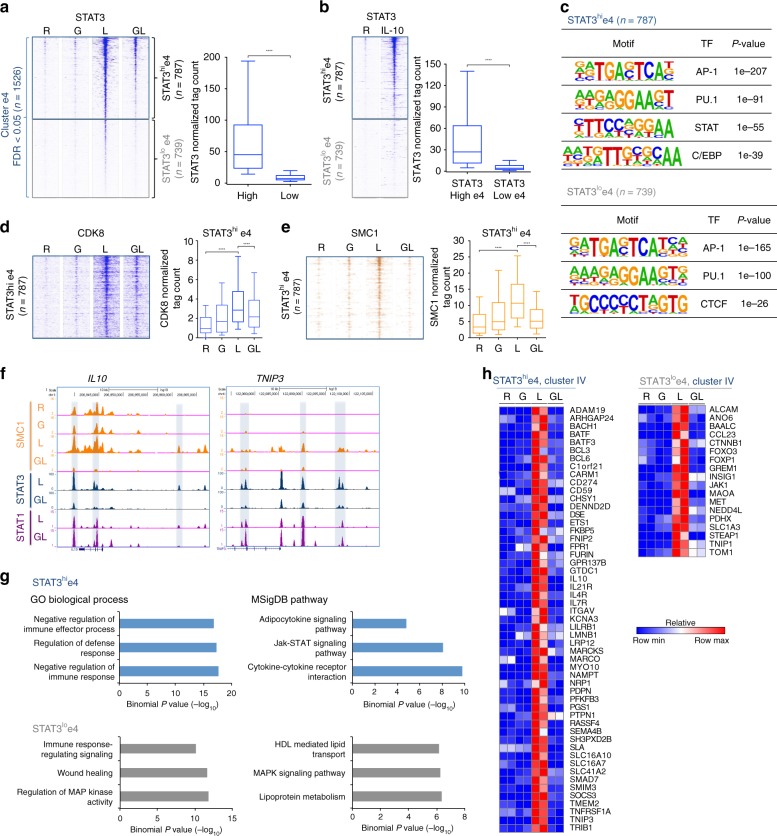
The strength of STAT3 binding divides e4 enhancers into two subgroups. a Heatmaps of STAT3 ChIP-seq signals at cluster e4 enhancers in the four indicated conditions. Enhancers were separated into two subsets: STAT3hie4 (n = 787) and STAT3loe4 (n = 739) based upon a cutoff of log2 normalized tag counts = 3). The boxplot (right) depicts normalized tag counts at STAT3hie4 and STAT3loe4 enhancers. b Heatmaps of STAT3 ChIP-seq signals at two subsets of e4 enhancers (defined in a) in resting and IL-10-stimulated macrophages. The boxplot (right) indicates normalized tag counts at STAT3hie4 and STAT3loe4 enhancers. c The most significantly enriched transcription factor (TF) motifs identified by de novo motif analysis using HOMER at STAT3hie4 (top) and STAT3loe4 (bottom) enhancers. d Heatmaps of CDK8 ChIP-seq signals at STAT3hie4 enhancers in the four indicated conditions. The boxplot (right) indicates normalized tag counts at STAT3hie4 enhancers. e Heatmaps of SMC1 ChIP-seq signals at STAT3hie4 enhancers in the four indicated conditions. The boxplot (right) indicates normalized tag counts at STAT3hie4 enhancers in four conditions. ****p < 0.0001, paired-samples Wilcoxon signed-rank test. f Representative UCSC Genome Browser tracks displaying normalized tag-density profiles at e4 enhancers of IL10 and TNIP3 in the indicated conditions. g Enriched Gene Ontology (GO) and MSigDB pathway categories of genes assigned to STAT3hie4 enhancers (upper panel) or STAT3loe4 enhancers (lower panel). h Heatmaps of IL-10-inducible cluster IV genes that correspond to STAT3hie4-associated genes (left panel) or non-IL-10-inducible cluster IV genes that correspond to STAT3loe4-associated genes (right panel). Data are representative of two independent experiments each of which included at least two independent donors (a, c, g, h) or depict one ChIP experiment using pooled samples from independent experiments using two (b) or four different donors (d, e). Boxes encompass the twenty-fifth to seventy-fifth percentile changes. Whiskers extend to the tenth and ninetieth percentiles. The central horizontal bar indicates the median

