Fig. 7.
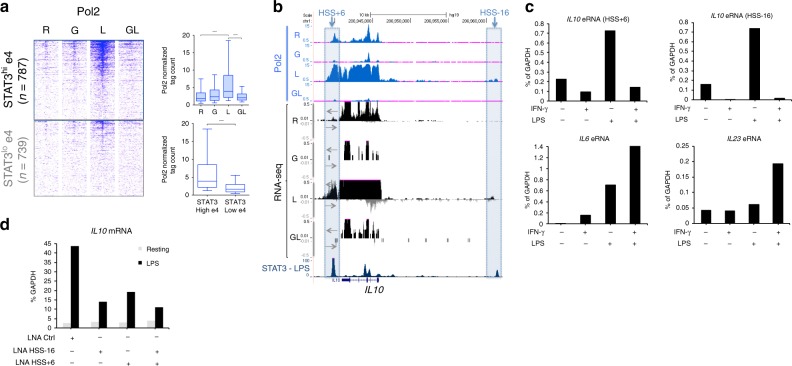
IFN-γ-mediated functional deactivation of STAT3-bound e4 enhancers. a Heatmaps of Pol II ChIP-seq signals at STAT3hie4 and STAT3loe4 enhancers (defined in Fig. 6a). The boxplots indicate normalized tag counts at STAT3hie4 enhancers in the four indicated conditions (top) and at STAT3hie4 and STAT3loe4 enhancers in LPS-stimulated macrophages (bottom). ****p < 0.0001, paired-samples Wilcoxon signed-rank test. Boxes encompass the twenty-fifth to seventy-fifth percentile changes. Whiskers extend to the tenth and ninetieth percentiles. The central horizontal bar indicates the median. b Representative Genome Browser tracks showing RNA polymerase II (Pol II) occupancy, strand-specific RNA transcripts, and STAT3 occupancy (LPS condition) at enhancers of IL10. Boxes enclose HSS + 6 (left) and HSS-16 (right). c RT-qPCR analysis of enhancer RNA (eRNA) expression at two e4 enhancers (top, IL10-HSS + 6 and IL-10-HSS-16) and two e5 enhancers (bottom, IL6 and IL23A). Data are representative of three independent experiments. d RT–qPCR analysis of IL10 mRNA in resting and LPS-stimulated macrophages transfected with the indicated LNAs (IL10-HSS-16 eRNA and and IL10-HSS + 6 eRNA). Data are representative of two independent experiments

