Fig. 1.
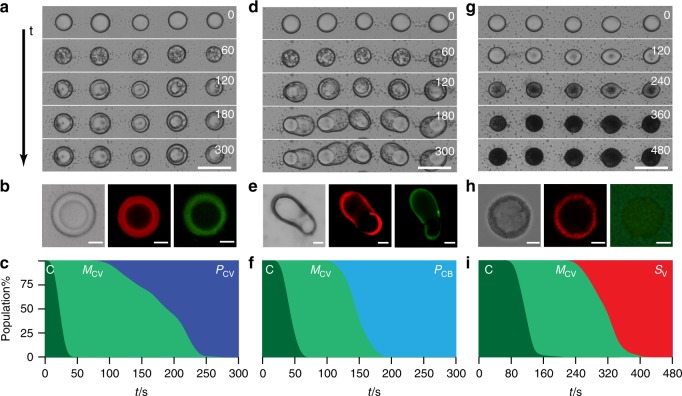
Morphological transformations under equilibrium conditions. a Time (t)-dependent optical microscopy images recorded from an acoustically formed array of PDDA/ATP coacervate micro-droplets at 0, 60, 120, 180 and 300 s after addition of a stirred solution of sodium phosphotungstate (POM, final concentration 2 mM). Scale bar, 100 µm. b Representative optical microscopy image (left), and RITC-PAH-doped (middle, red fluorescence) and TNP-ATP-doped (right, green fluorescence) fluorescence microscopy images of a single-POM/coacervate vesicle. Scale bars, 20 µm. c Corresponding area plot showing time-dependent changes in the numbers of native coacervate micro-droplets (C, dark green), multi-compartmentalized coacervate vesicles (MCV, light green) and spherical POM/coacervate vesicles (PCV, dark blue) over 300 s. Changes in populations are shown as percentage of total. d–f)As for a–c) but in the presence of a lower final POM concentration (1 mM) showing transformation of the coacervate micro-droplets into POM/coacervate vesicles with balloon-like morphology (PCB, light blue) via a series of MCV intermediates (see images at t = 60 s). Scale bars, 100 µm (d) and 20 µm (e). g–i As for a–c but without POM and in the presence of SDS micelles (final concentration, 20 mM). Optical microscopy images are recorded at 0, 120, 240, 360 and 480 s (g). The coacervate droplets transform into ATP-depleted SDS/PDDA vesicles (SV) (h). Transformation to SV (red area in (i)) occurs sequentially over 300 s via a MCV intermediate. Scale bars, 100 µm (g) and 5 µm (h). Source data are provided as a Source Data file

