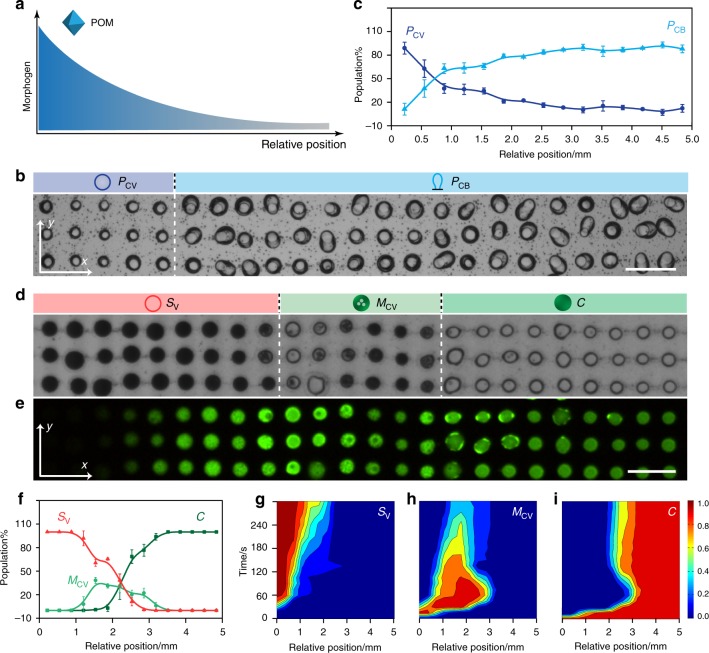
Fig. 2.
Protocell differentiation in unidirectional gradients. a Graphical representation of a unidirectional POM chemical gradient (x-axis). Similar experiments were undertaken with a SDS chemical gradient. b Optical microscopy image of an acoustically patterned array of PDDA/ATP coacervate droplets observed in the viewing window after exposure to a unidirectional POM diffusion gradient advancing along the x-axis. Images were recorded after no further changes in morphology were observed (15 min). Only a small section (3 × 23 droplet grid) of the array in the observation window is displayed. Sodium phosphotungstate (POM) is introduced into the chamber from the left-hand side of the image (50 µL, 12.5 mM, final POM concentration, 0.625 mM). Dashed white line marks the interface between the two differentiated protocell populations; spherical and balloon-shaped POM/coacervate vesicles, PCV (dark blue circle) and PCB (light blue graphic), respectively. Scale bar, 200 µm. (c) Plot showing changes in the population number densities of PCV and PCB morphological types along the chemical gradient (from left to right along the x-axis) after POM-mediated differentiation under conditions as described in (b); number of counted protocells, n = 1500. d Optical microscopy image of a PDDA/ATP coacervate droplet array after exposure to a SDS chemical gradient advancing along the x-axis. Images were recorded after no further changes in morphology were observed (30 min). Only a thin section (3 × 24 droplet grid) of the array viewed in the observation window is displayed. SDS is introduced into the chamber (50 µL, 50 mM; final concentration, 2.5 mM) from the left-hand side of the image. Three spatially separated populations consisting of ATP-depleted SDS/PDDA vesicles (SV; red circle; left side), multi-compartmentalized coacervate vesicles (MCV; green circle with dots; centre) and native coacervate droplets (C; green filled circle; centre) are observed. Dashed white lines mark the interfaces between the differentiated protocell populations; scale bar, 200 µm. e Corresponding fluorescence microscopy image for (d); droplets were initially prepared with green fluorescent TNP-ATP. f Plot showing changes in the population number densities of SV, MCV and C morphological types along the morphogen gradient (from left to right along the x-axis) after SDS-mediated differentiation under conditions as described in (d); number of counted protocells, n = 1500. g–i 2D plots showing spatial and temporal distributions of morphological types SV (g) MCV (h) and C (i) produced under conditions described in (d); colour scale represents percentage of a given population. Total number of counted protocells, n = 1500. The C to MCV transition occurs across regions of relatively high SDS concentration (left and centre-left) after approximately 30 s, followed by subsequent transformation to SV in areas of highest SDS concentration (far left). Coacervate droplets remain unchanged in domains of relatively low SDS concentration (right side). Source data are provided as a Source Data file. Error bars represent the standard deviation of the statistics count of the different lines of different protocells (n = 3)

