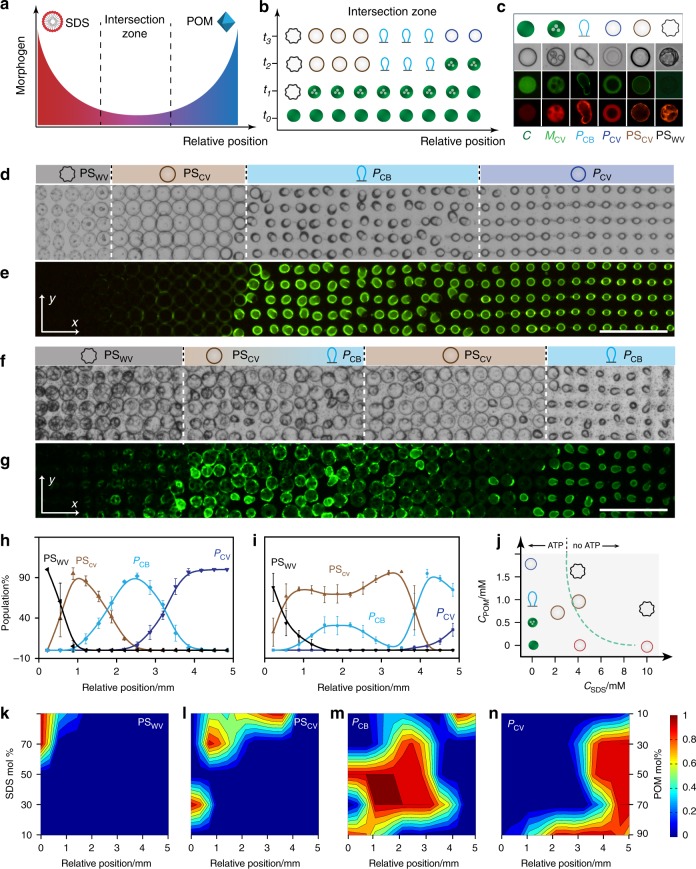
Fig. 3.
Protocell differentiation in opposing gradients. a Graphical representation showing counter-directional SDS (left, red) and POM (right, blue) chemical gradients along the x-axis. b Graphic showing possible sequence of morphogen-mediated transformations in the intersection zone shown in (a) for a single row of PDDA/ATP coacervate droplets (green filled circles, time t = 0). The various spatiotemporal responses produce a row of differentiated protocells with different morphologies (see (c) for details). Relative positions are along the x-axis; tn = time intervals. c Panel of protocell morphological types produced in the SDS/POM intersection zone displaying representative graphics (row 1) and corresponding optical (row 2) and fluorescence microscopy images (row 3, TNP-ATP green fluorescence; row 4, RITC-PAH red fluorescence). From left to right; native coacervate droplet (C, filled green circle), multi-compartmentalized coacervate vesicle (MCV, green circle with dots), balloon-shaped POM/coacervate vesicle (PCB, (light blue graphic), spherical POM/coacervate vesicle (PCV, dark blue circle), POM/SDS/coacervate vesicle (PSCV, red circle) and POM/SDS wrinkled vesicle (PSWV, black graphic). d, e Optical (d) and corresponding fluorescence microscopy (e) images showing a 2D array of differentiated protocells viewed in the observation window after intersection of an opposing reaction-diffusion gradient of SDS (from left to right) and POM (from right to left) at an initial SDS : POM molar ratio of 2.3. Four spatially distinct populations are observed (white dashed lines). Images were recorded after no further changes in morphology were observed (30 min); displayed grid size, 5 × 42. f, g As for d, e, respectively, but for an initial SDS : POM morphogen ratio of 9.0 showing a spatially interpenetrating community. Images were recorded after no further changes in morphology were observed (20 min); displayed grid size, 5 × 42; scale bar 500 µm. h, i Plots showing correlated changes in relative number densities of four different types of differentiated protocells (% population) with spatial position along the direction (x-axis) of opposing morphogen gradients produced at SDS : POM molar ratios of 2.3 (h) and 9.0 (i). j Plot showing a landscape of protocell morphological types produced at different SDS : POM molar ratios under non-diffusive equilibrium conditions. Graphics corresponding to the different forms shown in c except for the SDS/PDDA vesicle (SV; red circle). All the forms develop irreversibly via a MCV intermediate except for PSWV which is derived from PSCV. Dashed line indicates the presence or absence of a coacervate phase (with/without ATP, respectively). k–n 2D plots showing the spatial distributions for final populations of PSWV (k), PCV (l), PCB (m) and PSCV (n) morphological types produced in opposing morphogen gradients prepared by injection of different amounts of SDS and POM (% values). Colour scale represents percentage of a given population. Source data are provided as a Source Data file. Error bars represent the standard deviation of the statistics count of the different lines of different protocells (n = 3)

