Fig. 1.
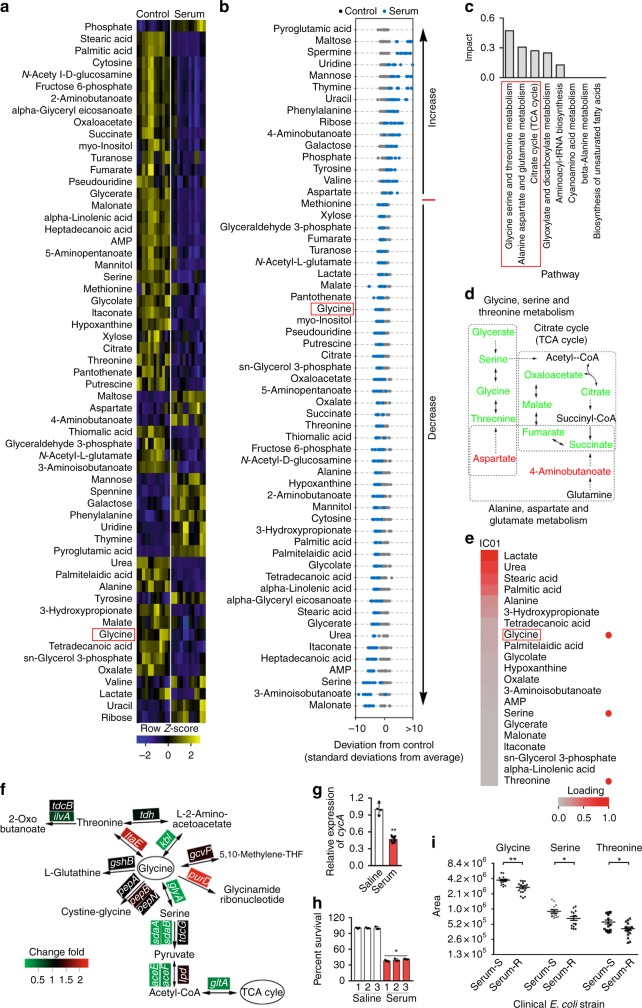
Serum-sensitive and -resistant bacteria have distinct metabolism. a Heat map showing relative abundance of 59 significantly differential metabolites in E. coli K12 in the absence (control) or presence (serum) of serum, as indicated. Heat map scale (blue to yellow, low to high abundance) is shown below data (n = 6). b Z-scores (standard deviation from average) corresponding to data in (a). c Pathway enrichment of significantly differential metabolites. Red box highlights the first three of most impacted pathways. d, Pathway interconnections of the first three most impacted pathways. The change of metabolite abundance is indicated as follows: black, no change; red, upregulation; green, downregulation; gray, not detected. e Hierarchical clustering of the decreased abundance of metabolites in serum-treated samples. Heat map scale (gray to red; low to high loading) is shown below data. Red box highlights glycine and red dot highlights glycine, serine and threonine metabolism. f, g qRT-PCR for the expression of glycine catabolism genes (f) and glycine transporter, cycA (g) in the presence or absence of 100 μL serum (n = 3). h Effect of repeated killing by serum on percent survival of E. coli K12. E. coli K12 was treated with serum (1) for selection of survivors, which was treated by the other two round of serum treatments (2 and 3). Percent of survival was calculated (n = 3). i Scatter plots showing a normalized abundance of glycine, serine, and threonine in eight serum-susceptible (Serum-S) and eight serum-resistant (Serum-R) clinical E. coli strains (n = 8). Results (g–i) are displayed as mean ± SEM, and significant difference is identified (*p < 0.05; **p < 0.01) as determined by two-tailed Student’s t test. See also Supplementary Figs. 1–4

