Fig. 5.
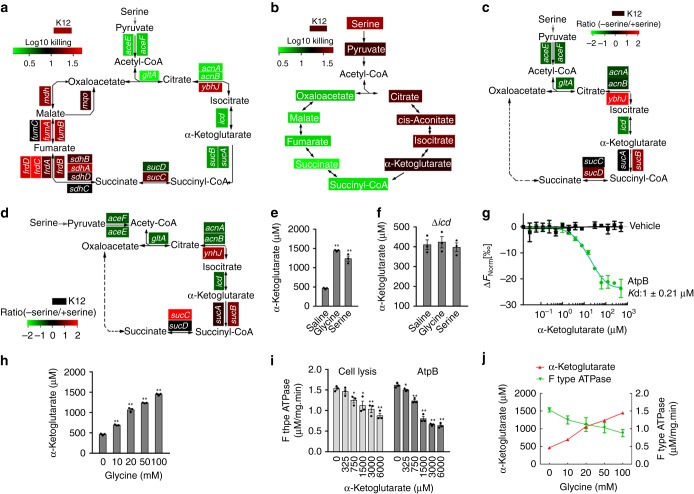
The TCA cycle regulates bacterial serum susceptibility. a Summary of relative survival of the indicated mutant strains of E. coli K12 in the presence or absence of 50 mM serine plus 100 µL serum for 2 h (n = 3). b Summary of relative survival of E. coli K12 in the presence or absence of the indicated metabolites of the TCA cycle plus 100 µL serum for 2 h (n = 3). c, d Summary of relative ATP synthase activity (c) and ATP content (d) of the indicated mutant strains of E. coli K12 for 2 h in the presence and absence of 50 mM serine plus 100 μL serum. Heat map scale (a–d) (green to red) represents low to high killing (a, b) or ratio (c, d) without the indicated genes (a, c and d) or with the indicated metabolites (b) (n = 3). e, f Intracellular α-Ketoglutarate concentration in the presence or absence of 100 mM glycine or serine (e), and the effect of loss of icd (f) (n = 3). g AtpB and α-Ketoglutarate interaction assay by MST (n = 3). h Effect of exogenous glycine (0–100 mM) on the intracellular α-Ketoglutarate level (n = 3). i Measurement of intracellular ATP synthase activity using E. coli K12 cell lysis (cell lysis) or purified recombinant AtpB plus the indicated concentration of α-Ketoglutarate (n = 3). j The interrelation between α-Ketoglutarate level and intracellular ATP synthase activity from data (h, i) (n = 3). Results (e–j) are displayed as mean ± SEM, and significant differences are identified (*p < 0.05, **p < 0.01) as determined by two-tailed Student’s t test (e, h, i). See also Supplementary Fig. 9

