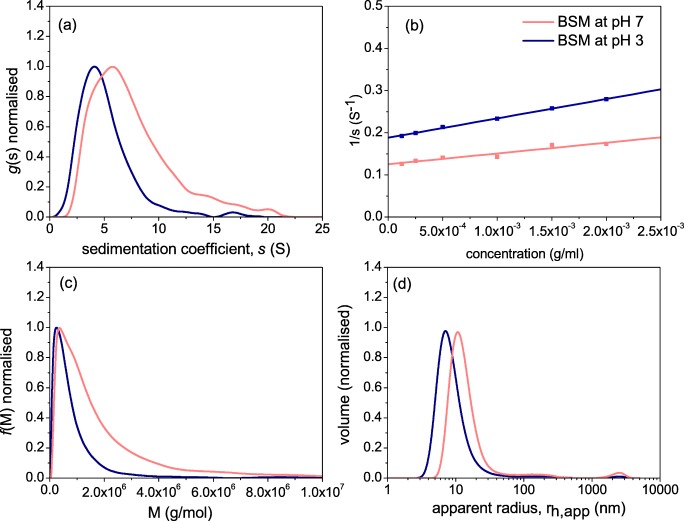
Fig. 3.
Comparative hydrodynamic properties of bovine submaxillary mucin at pH 7.0 and at pH 3.0 (a) sedimentation coefficient g(s) distribution at 0.25 mg/ml; b reciprocal plot of s versus concentration, fitted to (1/s) = (1/s°)(1 + ksc) where ks is the concentration dependence ‘Gralén’ coefficient [47]; c molecular weight distribution from sedimentation velocity and Extended Fujita analysis, f(M) versus M for a loading concentration of 0.25 mg/ml. κs = 0.007606 and b = 0.483; d Distribution of the apparent hydrodynamic radius rh,app. Experiments performed in PBS buffer 0.1 M (pH 7.0) and Na-citrate buffer 0.1 M (pH 3.0) at a temperature of 20.0 °C

