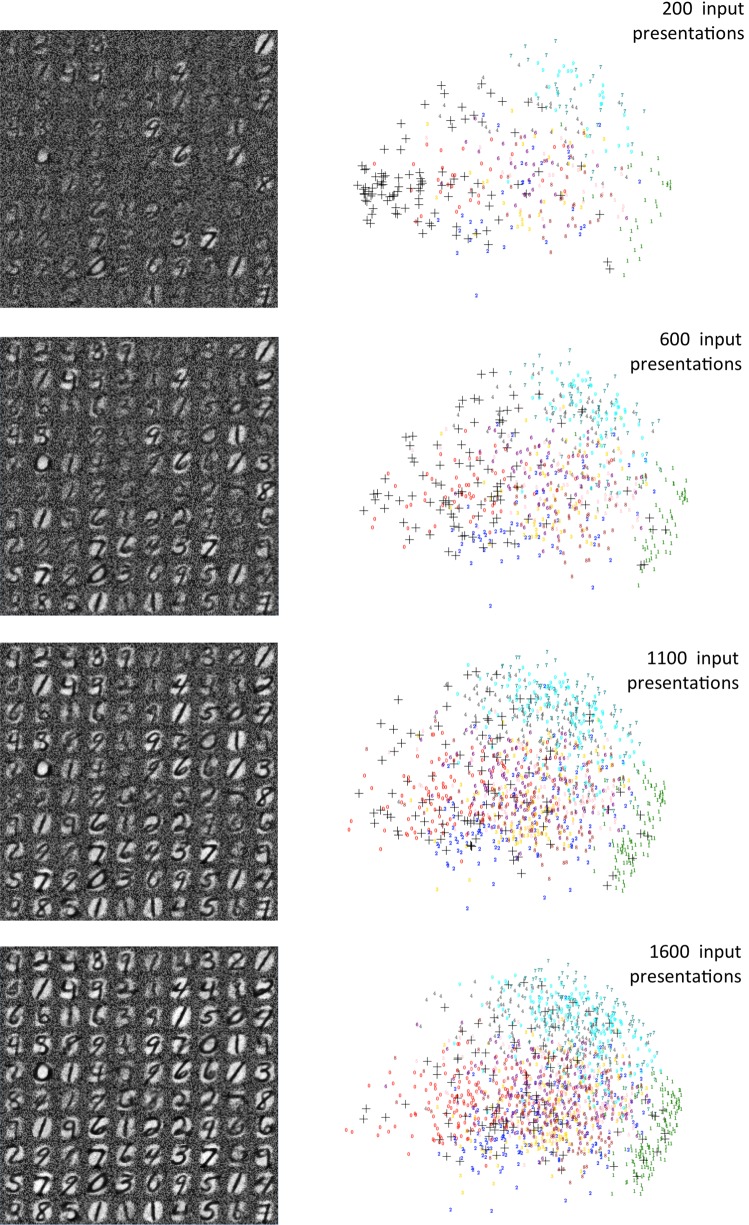
Fig. 3.
Visualization of stages in self-organized mapping out of 100 cluster points in MNIST feature space over the course of presentation of 1600 training digits. The left column shows, at 4 stages, the average weight of plastic synapses from each rate-coded input pixel to each of the 100 neuron subpopulations. The right column shows the learned cluster points (black crosses) in a 2D PCA projection of feature space overlaying the set of data points presented up to that stage (colored digits). As inactive pixels in the input will retain their high initial weighting, we first masked out (neglected) the least active 10% of pixels across the training set in order to meaningfully plot the clusters’ points against the input dataset

