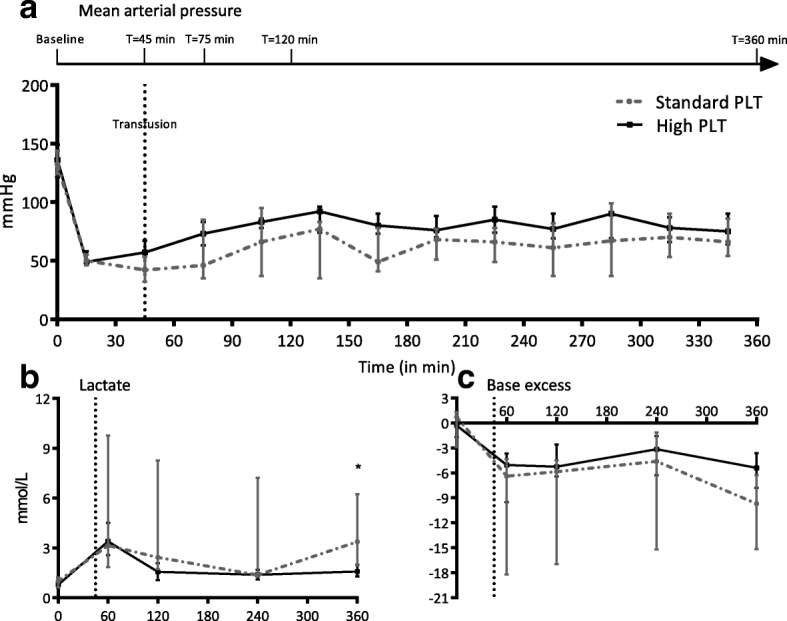
Fig. 1.

Shock parameters. Data are presented as median (IQR). a Mean arterial pressure. Line with arrow represents specific time points of coagulation status assessment during the experiment. Baseline (=before trauma), T = 45 min (=just before initiation of resuscitation), T = 75, T = 120, and T = 360 min (after injury). b Lactate. c Base excess. PLT platelet transfusion, MAP mean arterial pressure. Dotted vertical line at 45 min represents initiation of resuscitation. *p < 0.050 between groups
