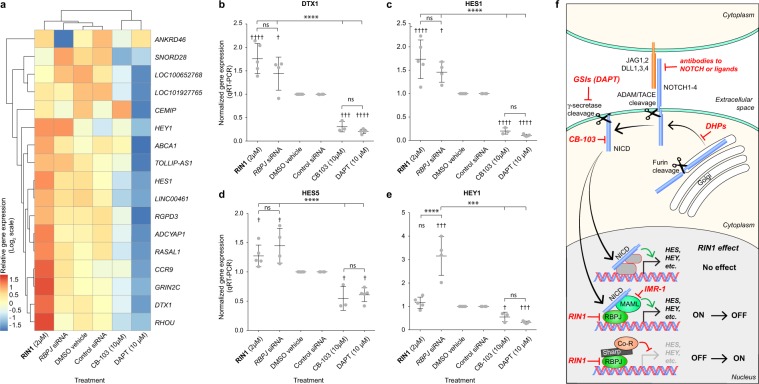
Figure 4.
Gene expression changes induced by RIN1. Jurkat cells were treated with either 8 hours with small molecules or 48 hours with transfected RBPJ siRNA and DMSO-vehicle or control (inert sequence) siRNA, respectively. The heatmap represents changes in the levels of transcript (fold change > 2, P < 0.05) that were induced by either the small molecules or RBPJ siRNA relative to their respective controls (DMSO vehicle or control siRNA) and varied < 40% between techniques (DMSO-vehicle vs. control siRNA. (b–e) qRT-PCR analysis of RBPJ target gene expression. Data are presented as mean ± standard deviation. Incrementing symbols (* and †) denote P < 0.05, P < 0.01, P < 0.001 and P < 0.0001 respectively, using two-way ANOVA with Dunnett’s post-test. *between groups indicated; †relative to respective control treatments (DMSO or control siRNA). ns, not significant. (f) Schematic showing NOTCH pathway inhibitors (red text) in relationship to signaling and summary of RIN1 effects on downstream gene expression.

