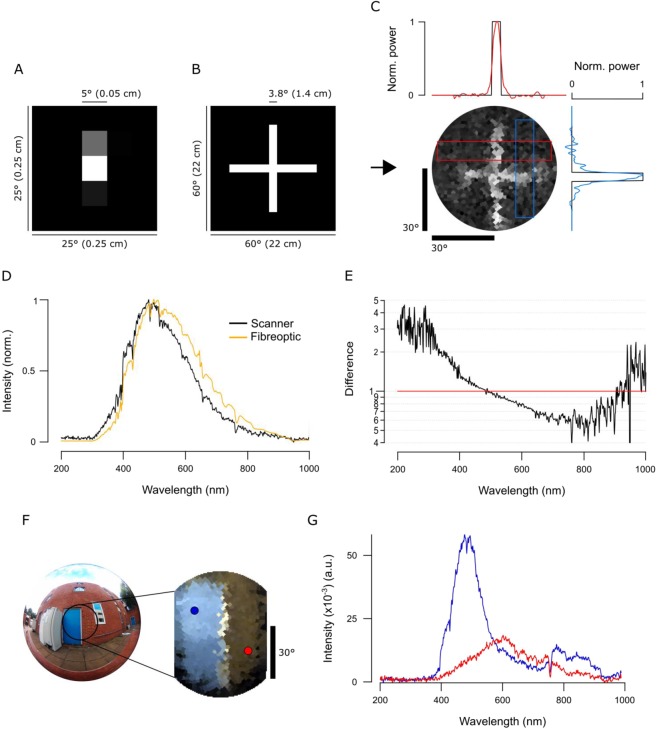
Figure 3.
Scanner performance. (A) Single pixel field of view (FOV) is vertically elongated as determined by spot-mapping. (B,C) A printout of a 3.8° white cross on a black background (B) was scanned with a 1,000 point spiral scanning path (Fig. 2D) to estimate the scanner’s spatial resolution. In (C), power (red and blue lines in the graphs) represents brightness profiles across the cross’ arms as indicated, superimposed on the original profile (black). (D) Spectrometer readings of a clear daylight sky taken through the spectrometer’s fibreoptic (orange) and through the complete optical path of the scanner (black, i.e. 2 mirrors and a quartz window, though lacking the fibreoptic). When purchased, the spectrometer is calibrated with the fibreoptic attached. Accordingly, we computed the corresponding correction curve and applied it to all scanner data presented throughout this work (E). (F) An action camera picture of the blue door + red brick wall measured outdoors and an RGB representation image of the scan when using opsin templates from human spectral sensitivity. Blue and red dots in the RGB representation refer to the two points used to show examples of individual spectra in (G).

