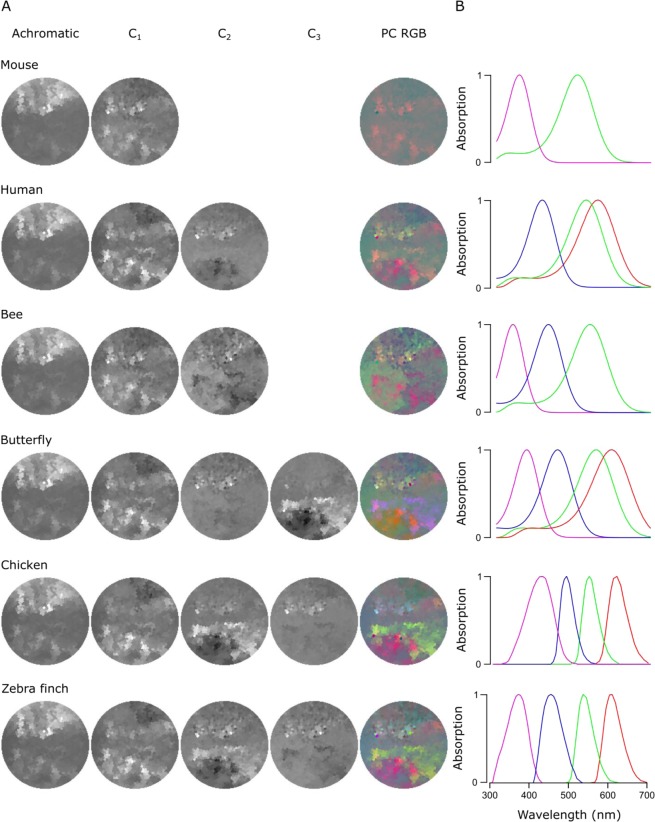
Figure 6.
PC reconstructions of the forest scene. (A) Achromatic and chromatic PCA reconstructions from the forest scene data for a mouse (Mus musculus), a human (Homo sapiens), a bee (Apis melifera), a butterfly (Graphium sarpedon), a chicken (Gallus gallus domesticus) and a zebra finch (Taeniopygia guttata) and PC RGB pictures. The number of chromatic axes equals to the number of cone types minus 1. Again, the PC RGB picture is constructed from chromatic axes C1-n. In PC RGB, the C1 is shown as red, C2 as green and C3 as blue. (B) Opsin absorption curves showing the spectral sensitivity of the cones for each animal. The pink, blue, green and red curves correspond to UV, blue, green and red sensitive opsins, respectively.

