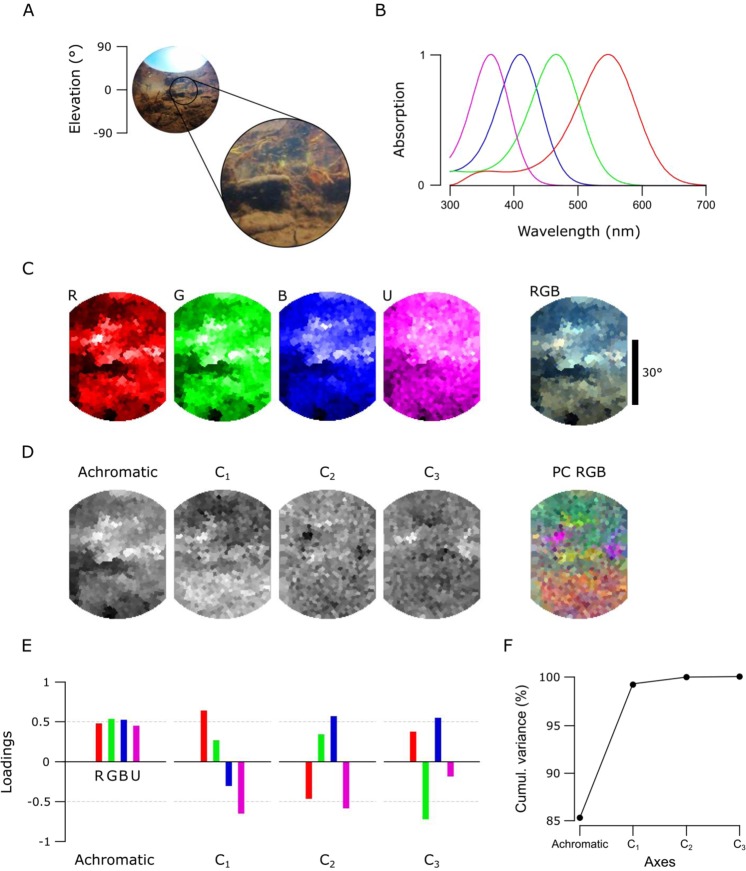
Figure 8.
An underwater scene from India with zebrafish spectral sensitivity. (A) A 180° photo of the scanned underwater river scene from West Bengal, India, and the approximate 60° scanner covered window. (B) The zebrafish opsin complement. (C) The monochromatic opsin channels (RGBU) and the RGB reconstruction as in Fig. 5. (D) The achromatic and chromatic axes reconstructed back to images to show where in the scene information based on each axis can be found. (E) Loadings from each opsin channel as explained in Fig. 4E. (F) The cumulative variance explained (%) for each axis.

