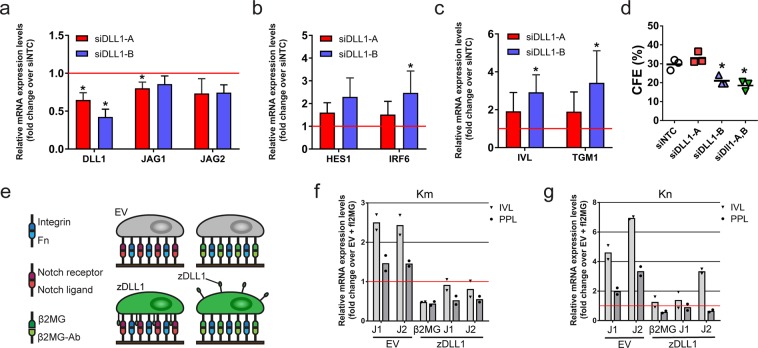
Figure 4.
Cis inhibition mediated by Dll1 inhibits Jagged-induced differentiation. (a–c) Q-RT PCR analysis of mRNA levels of Notch ligands (a), Notch target genes (b) and terminal differentiation markers (c) in keratinocytes (strain km) transfected with two different Dll1-specific siRNAs or with a non-targeting control (NTC) siRNA and cultured under conditions that facilitated cell-cell interaction. Data shown are from n = 3 independent experiments performed with two biological replicates (independent siRNA transfections). Individual data points represent the average fold change in mRNA abundance (normalized to 18sRNA) compared to siNTC in each experiment. Bars represent the mean. P-values were calculated using one-way ANOVA with Holm Sidak’s multiple comparisons test (*p < 0.05). (d) Clonal growth of keratinocytes (strain km) transfected with the indicated siRNAs. Data shown are from n = 3 independent experiments performed with three technical replicates. Individual data points represent average percentage of colonies formed per number of cells seeded (colony formation efficiency, CFE); lines represent the mean. P-values were calculated using one-way ANOVA with Holm Sidak’s multiple comparisons test (*p < 0.05). (e) Schematic outline of the experimental setup used in (f,g). (f,g) Q-RT PCR analysis of terminal differentiation marker expression in keratinocytes (strain km, (f); strain kn, (g)) expressing zDLL1 or EV 48 hours after seeding onto substrates functionalized with the indicated proteins. Data shown in f and g are from n = 1 experiment performed with two technical replicates. Individual data points represent the average fold change in mRNA abundance (normalized to 18sRNA) compared to control (EV cells growing on substrates functionalized with anti-β2MG antibodies) in each experiment. Bars represent the means.

