Figure 6.
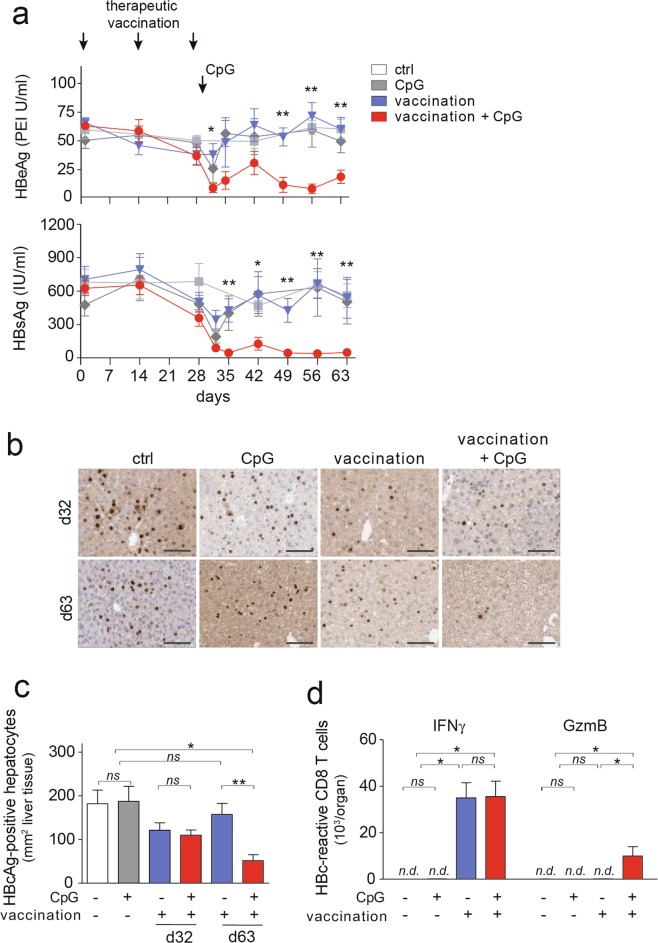
Control of numbers of HBcAg-expressing hepatocytes after therapeutic vaccination ± CpG injection in AAV-HBV-infected mice. (a) Time course of serum HBeAg and HBsAg levels after therapeutic heterologous prime-boost vaccination. (b,c) Liver immunohistochemistry of HBcAg-expressing hepatocytes at d32 and d63 after start of vaccination (d3 and d34 after CpG-injection) and quantification. (d) Flow cytometric evaluation of intracellular GzmB and IFNγ in HBcAg-specific CD8 T cells after restimulation ex vivo. Bars in (a,c,d) indicate mean value of n ≥ 3 mice per group + SEM. Statistical analyses was performed using (a) 2-way ANOVA with Tukey’s multiple comparison correction and (c,d) Kruskal-Wallis test with Dunn’s multiple comparison correction. Asterisks mark statistically significant differences: *p < 0.05; **p < 0.01; ns – not significant; n.d. – not detectable.

