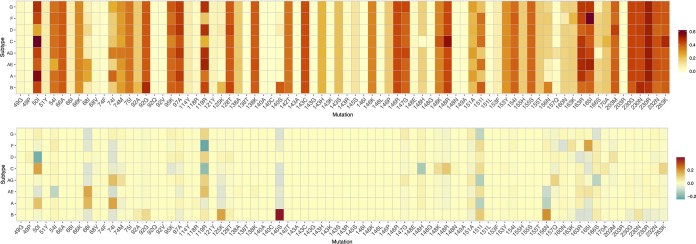
FIG 3.
Top, estimated population genetic barrier for each combination of a resistance-associated mutation and a subtype. A higher value (red) represents an increased potential for adaptation and is indicative of a lower genetic barrier to resistance. A subtype-specific value of this population genetic barrier is calculated by first assigning each wild-type triplet with a score that indicates the ease to evolve into the resistance amino acid (see Materials and Methods for a detailed description of how this cost score for a wild-type triplet is derived). Next, the sum of all triplet scores is weighted by the triplet prevalence so that the most frequently occurring triplets have a larger impact on the population genetic barrier estimate. Bottom, average difference in population genetic barrier of each subtype from the other subtypes. A lower genetic barrier to resistance for that subtype than for the other subtypes is shown in red, while a higher genetic barrier is shown in green.

