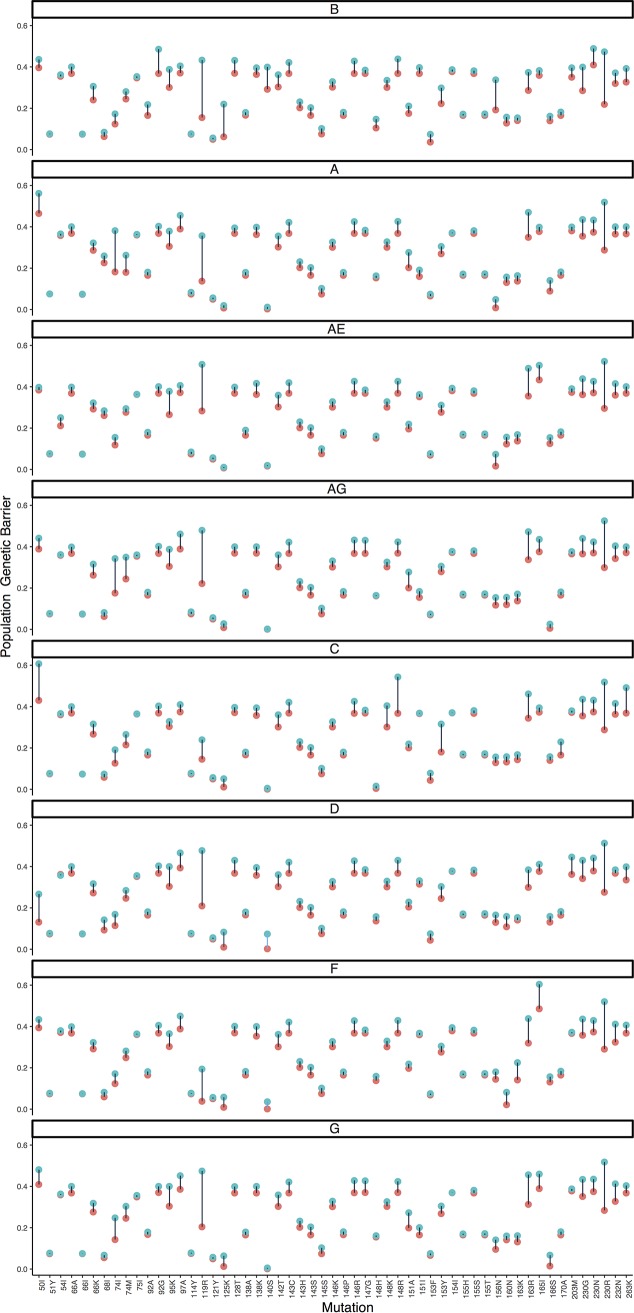
FIG 4.
Each of 8 panels shows the estimated population genetic barrier for a single subtype, with the estimate either calculated as described in Materials and Methods (blue) or calculated by a simpler but similar methodology (red). Instead of obtaining the cost score for each wild-type triplet by summing all possible cumulative costs (blue), thereby taking into account almost equally likely substitution pathways of a wild-type triplet to the resistance amino acid, a cost score can also be calculated by only using the minimum cumulative cost (red); therefore, this only considers the shortest substitution pathway to the resistance amino acid and ignores other but almost equally likely mutational pathways to resistance. To increase the comparability of the two measures, we also took the negative exponential of the minimum score. Only increases in values are possible due to the summation, and we restricted the figure to the subset of mutations with a difference larger than 0.01.

