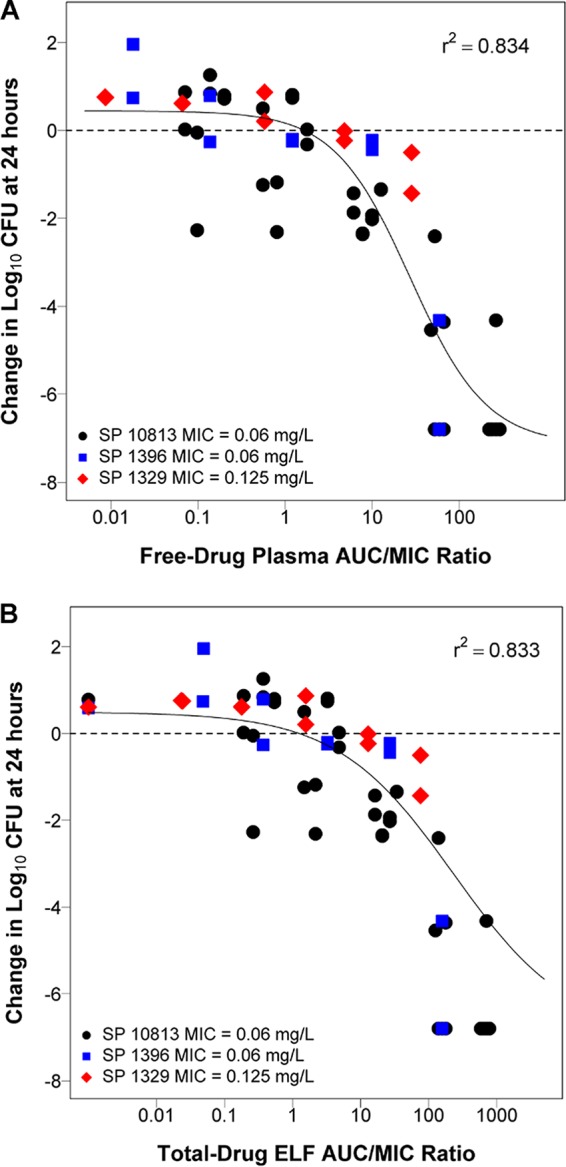
FIG 3.

Relationship between the free-drug plasma (A) and total-drug ELF (B) AUC/MIC ratio and the change in log10 CFU from baseline at 24 hours based on pooled data for S. pneumoniae ATCC 10813, CDC 1396, and CDC 1329. Each symbol represents the change in log10 CFU from baseline in the lungs of mice at 24 hours. The horizontal line represents the bacterial burden at the start of therapy.
