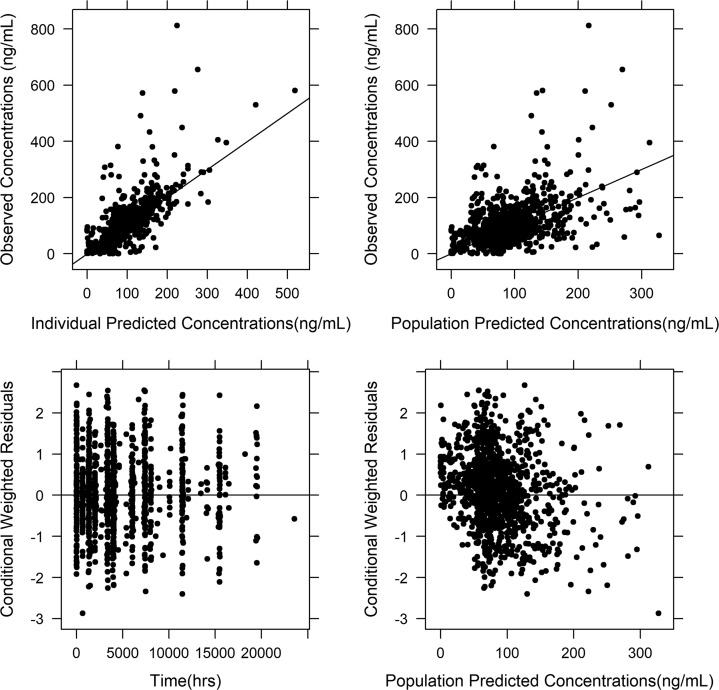
FIG 2.
Basic goodness-of-fit plots for the developed population pharmacokinetic model. The graph at the top left represents individual predicted and observed concentrations, and the graph at the top right represents population predicted concentrations and observed concentrations. The graph at the bottom left represents time versus conditional weighted residuals, and the graph at the bottom right represents population predicted concentrations versus conditional weighted residuals. None of these plots showed any major bias in the model, suggesting that the developed model is acceptable.

