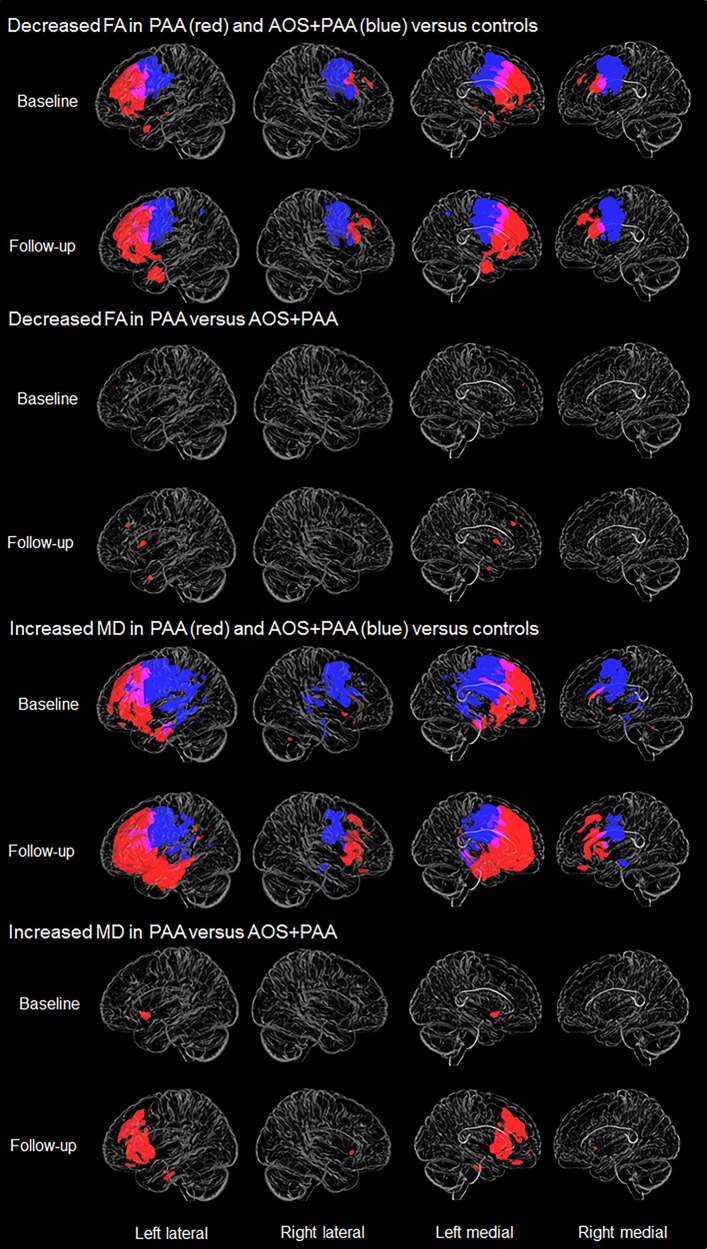
Figure 3.
Voxel-level maps of fractional anisotropy (FA) and mean diffusivity (MD) in PAA and AOS+PAA. The top two rows are 3D transparent renders showing decrease in fractional anisotropy in PAA (red) and AOS+PAA (blue) versus controls at baseline and follow-up, respectively. The third and fourth rows show regions where fractional anisotropy is decreased in PAA compared to AOS+PAA at both time points. Rows five and six show increase in mean diffusivity in PAA (red) and AOS+PAA (blue) versus controls at baseline and follow-up, respectively. The bottom two rows show regions of increased mean diffusivity in PAA compared to AOS+PAA at both time points. All results are FWE corrected at P < 0.05.

