FIGURE 3.
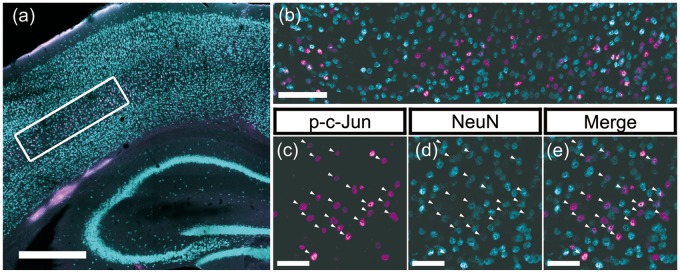
Representative immunofluorescent images demonstrating p-c-Jun/NeuN colocalization. Representative immunofluorescent images that underwent quantitative assessments of the burden of diffuse axonal injury in layer V neurons. All presented images originate from the same animal in the HR group and show representative findings after double labeling with p-c-Jun (magenta) and NeuN (cyan), which were used as markers for the axotomized neuronal populations and the total neuron populations, respectively. (A) Tiled, 10× magnification image labeling p-c-Jun and NeuN. The white rectangle in the figure presents the location of region of interest (ROI) centering on the layer V neurons. Note that, p-c-Jun signals are distributed primarily in neocortical layer V, consistent with this well-established animal TBI model that generates axotomized neurons in this domain. Scale bar = 500 μm. (B) A 20× magnification image of the ROI in neocortical layer V delineated by a white rectangle in panel (A). Fluorescent signals labeling p-c-Jun (magenta) or NeuN (cyan) are distributed broadly in the ROI, showing colocalization. Note, however, that colocalization did not show one to one correspondence. Scale bar = 100 μm. Panels (C–E) are enlarged images of one portion of panel (B), in which p-c-Jun and NeuN are presented. Each panel (C) and (D) presents single channel image for p-c-Jun and NeuN, respectively. Panel (E) presents their merged image. Arrowheads indicate the neurons with p-c-Jun and NeuN colocalization. Scale bars = 50 μm.

