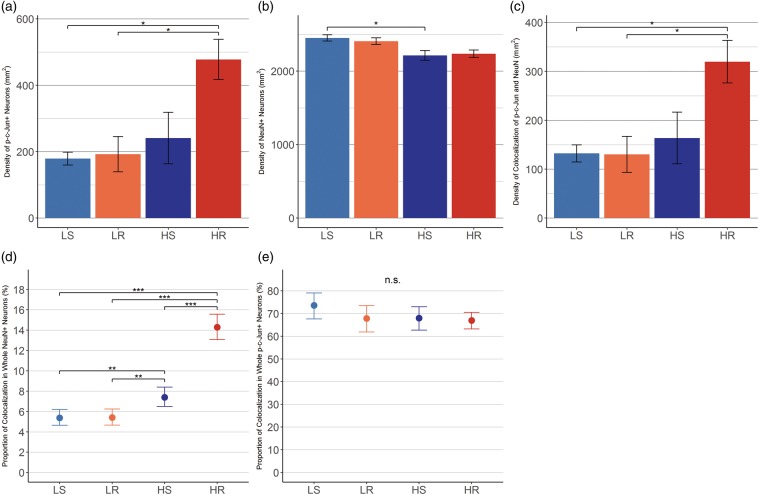
FIGURE 5.
Quantitative assessment of p-c-Jun+/NeuN+ neurons. Quantitative assessments of p-c-Jun+/NeuN+ neurons. (A) The density of p-c-Jun+ neurons in the ROI. HR group demonstrated significant difference compared with LS and LR groups, but not to HS group (vs LS; d = 3.09, p = 0.012. vs LR; d = 2.11, p = 0.017. vs HS; d = 1.37, p = 0.0528). (B) The density of NeuN+ neurons in the same ROI. Significant difference was observed in comparison between HS and LS groups (r = 0.84, p = 0.045). (C) The density of p-c-Jun/NeuN colocalization. HR group demonstrated significant difference compared with LS and LR groups, but not to HS group (vs LS; d = 2.60, p = 0.025. vs LR; d = 2.00, p = 0.024. vs HS; d = 1.31, p = 0.071). (D) The proportions of p-c-Jun/NeuN colocalization in the total NeuN+ neuron population. Estimated proportion of axotomy was 14.3% (95% CI; 13.1%–15.6%) in HR group, 7.4% (95% CI; 6.5%–8.4%) in HS, and they were significantly different. The OR of HR group to HS was 1.93 (95% CI; 1.63–2.28). In contrast, LR and LS group did not show significant difference and the OR was 1.01 (95% CI; 0.81–1.24). (E) The proportion of p-c-Jun/NeuN colocalization within p-c-Jun+ neuron population. Approximately 70% of p-c-Jun+ neurons were positive for NeuN. There was no difference between the groups. Error bars indicate the standard error of the means in (A–C) and 95% CI of the estimated proportions in (D) and (E). Pairwise comparisons were assessed by Tukey’s HSD test in (A–C), and by Chi-square test followed by pairwise Chi-square test with Holm’s correction in (D) and (E). d; Cohen’s d with Hedges correction, r; effect size for comparison of nonparametric variables, 95% CI; 95% confidence interval. *p < 0.05, **p < 0.01, ***p < 0.001, n.s.; not significant. LS; lower intensity single mild injury, LR; lower intensity repetitive mild injury, HS; higher intensity single mild injury, HR; higher intensity repetitive mild injury.

