Figure 5.
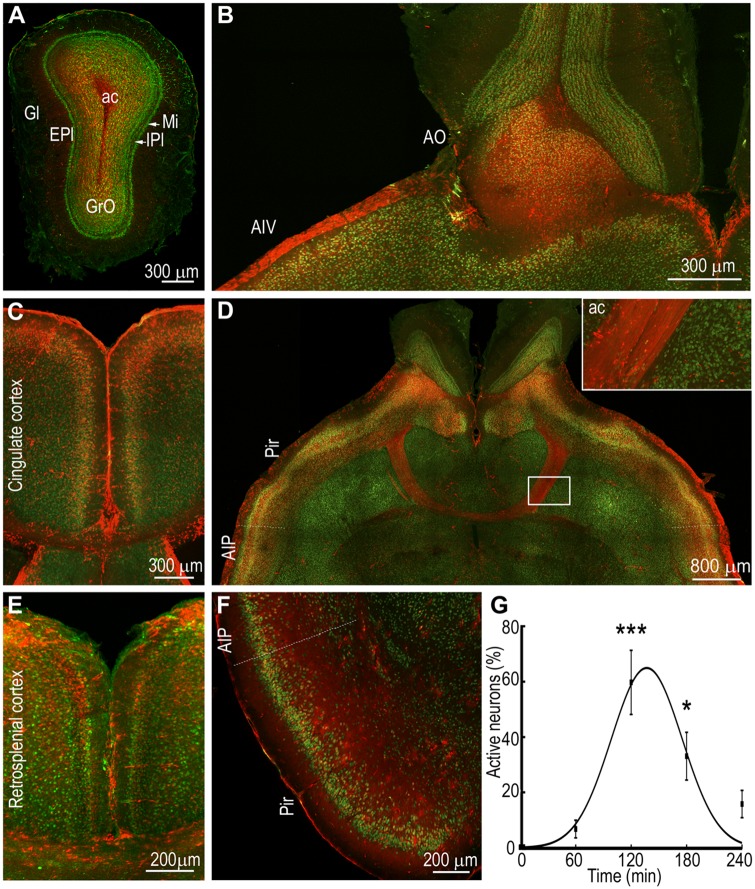
Intense activation of the olfactory system during status epilepticus. (A) A section through the olfactory bulb showing intense activation of granule cells (GrO) and little activation of the neurons in the glomerular layer (Gl) and external plexiform layer (EPI) at T0 + 120 min. Other areas marked are the internal plexiform layer (IPI), mitral cell layer (MI), and anterior commissure (ac). (B) An image showing strong activation of the olfactory nucleus (AO) and ventral agranular insular cortex (AIV). (C) A section showing TRAPed neurons in the superficial layers of cingulate cortex. (D) A horizontal section showing the anterior commissure (ac) with axons filled with tdTomato fluorescence joining the two hemispheres containing TRAPed neurons in the piriform cortex (Pir) and posterior agranular insular cortex (AIP). The inset shows a magnified region of the ac. (E) An image showing bilateral activation of neurons of the superior layers of the retrosplenial cortex. (F) Extensive TRAPing of the neurons of the posterior agranular insular cortex and piriform cortex is also visible in a section in the coronal orientation. (G) The number of TRAPed neurons in the piriform cortex were counted in one 10-µm thick optical section and plotted against time; n = 3 each at T0, T0 + 60, +120 and +180 and n = 2 at +240 min. ***P < 0.0005 and *P < 0.05 versus T0, ANOVA with Dunnett’s multiple comparison test. The line shows the fit of the data to a Gaussian curve.

