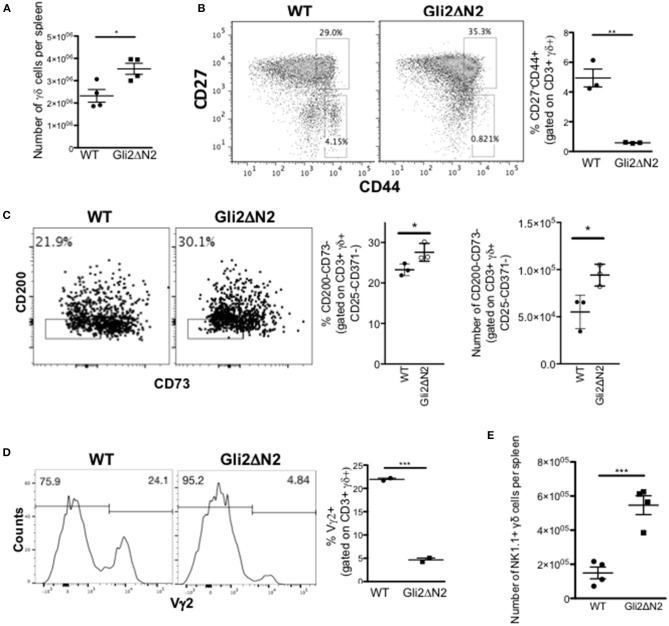
Figure 7.
Hh-mediated transcription in γδ T-cells influences γδ T-cell populations in adult spleen. (A–D) Gli2ΔN2-transgenic and WT littermate spleens were analyzed by flow cytometry. In scatter plots each point represents data from a different mouse; bars show mean ± SEM. (A) The number of CD3+γδ+ cells in the spleen. (B) Representative dot plot shows anti-CD27 and anti-CD44 staining gated on CD3+γδ+ cells from WT and Gli2ΔN2-tg spleen, giving the percentage of cells in the regions shown. Scatter plot shows the percentage of CD27-CD44+ cells, gated on CD3+γδ+ cells in the spleen. (C) Representative dot plot shows anti-CD200 and anti-CD73 staining, gated on CD3+γδ+CD25-CD371- cells from WT and Gli2ΔN2-tg spleen, giving the percentage of cells in the region shown. Scatter plots show the percentage of CD200-CD73- cells, gated on CD3+γδ+CD25-CD371- cells, and the number of CD200-CD73-CD3+γδ+CD25-CD371- cells in WT and Gli2ΔN2-tg spleen. (D) Representative histograms show anti-Vγ2 staining, gated on CD3+γδ+ cells in the spleen, giving the percentage of cells in the marker shown. Scatter plots shows the percentage of Vγ2+ cells, gated on CD3+γδ+ cells in the spleen. (E) Scatter plot shows the number of NK1.1+ cells, gated on CD3+γδ+ cells in the WT and Gli2ΔN2-tg spleen. *p < 0.05; **p < 0.01; ***p < 0.005.

