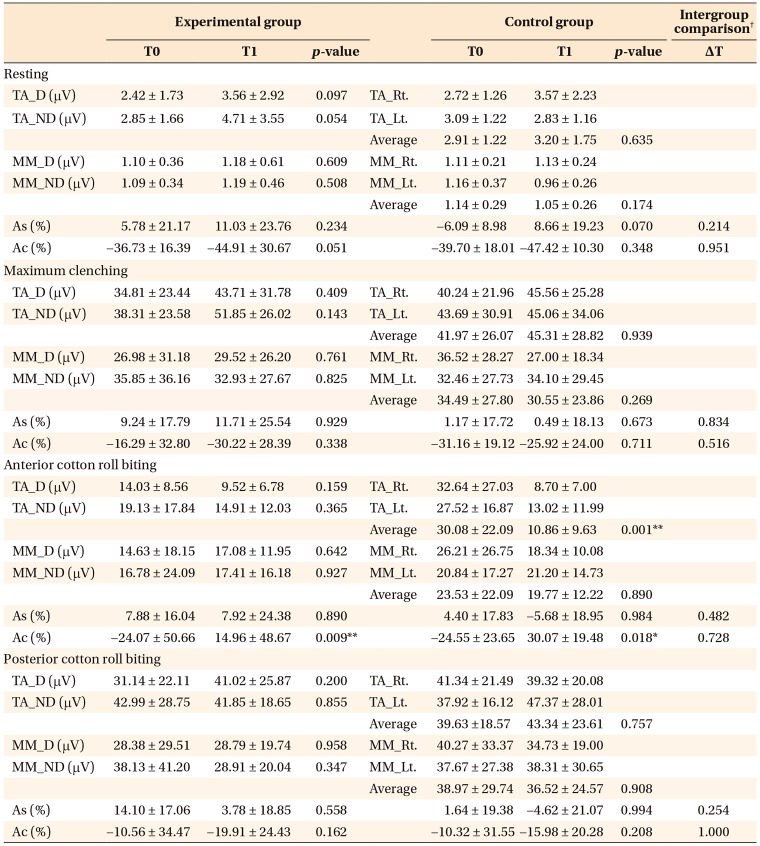
Table 3. Inter- and intragroup comparison of electromyography (EMG) potentials.
Values are presented as mean ± standard deviation.
In the control group, the measurements on the left and the right sides were pooled together for statistical analysis because the differences between the two sides were not significant.
Expermimental group, Class III facial asymmetry; Control group, Class III without facial asymmetry; T0, initial; T1, 7–8 months after orthognathic surgery; TA_D, EMG activity of the anterior temporalis muscle (TA) on the deviated side; TA_ND, EMG activity of the TA on the non-deviated side; MM_D, EMG activity of the superficial masseter muscle (MM) on the deviated side; MM_ND, EMG activity of the superficial MM on the non-deviated side; TA_Rt, EMG activity of the TA on the right side; TA_Lt, EMG activity of the TA on the left side; MM_Rt, EMG activity of the superficial MM on the right side; MM_Lt, EMG activity of the superficial MM on the left side; As, asymmetry index; Ac, activity index.
Paired t-test was performed: *p < 0.05; **p < 0.01; †Independent t-test was performed.

