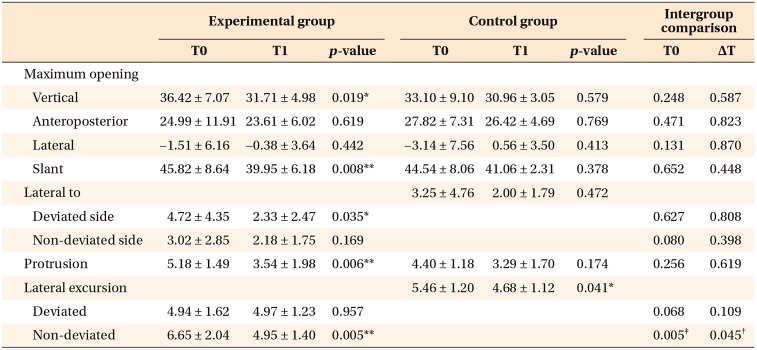
Table 4. Inter- and intragroup comparison of jaw movement variables in the range of motion (mm).
Values are presented as mean ± standard deviation.
Expermimental group, Class III facial asymmetry; Control group, Class III without facial asymmetry; T0, initial; T1, 7–8 months after orthognathic surgery.
Paired t-test was performed: *p < 0.05, **p < 0.01; Independent t-test was performed: †p < 0.05, ‡p < 0.01.

