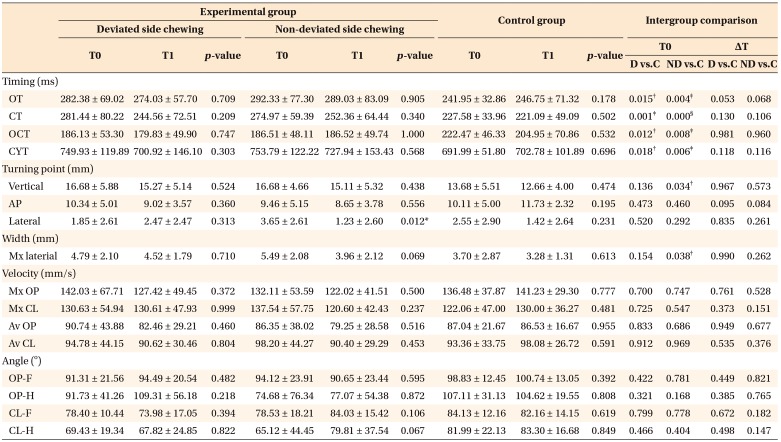
Table 5. Inter- and intragroup comparison of jaw movement variables of unilateral average chewing pattern (ACP).
Values are presented as mean ± standard deviation.
Expermimental group, Class III facial asymmetry; Control group, Class III without facial asymmetry; T0, initial; T1, 7–8 months after orthognathic surgery; D, chewing in the deviated side; ND, chewing in the non-deviated side; C, unilateral chewing in the control group; OT, opening time; CT, closing time; OCT, occlusal time; CYT, cycle time; AP, anteroposterior; Mx, maximum; OP, opening; CL, closing; Av, average; F, frontal; H, horizontal.
Paired t-test was performed: *p < 0.05; Independent t-test was performed: †p < 0.05, ‡p < 0.01, §p < 0.001.

