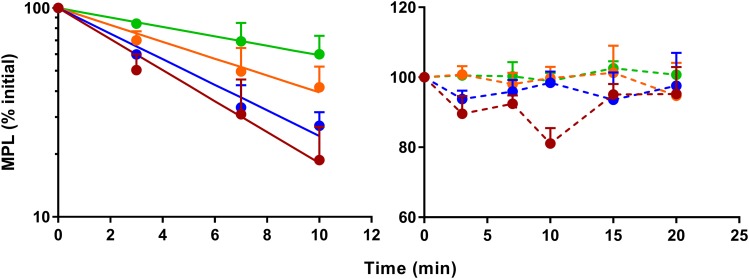
Fig. 3.
Time course of in vitro stability of MPL in liver homogenates prepared at 3× (red), 4× (blue), 6× (orange), and 10× (green) dilutions from freshly harvested male (left) and female (right) livers. Symbols represent the mean ± S.D. (n = 3 per time point), the solid line depicts the first-order loss kinetics of MPL in male liver homogenates, and the dashed lines connect the data points.

