Fig. 5.
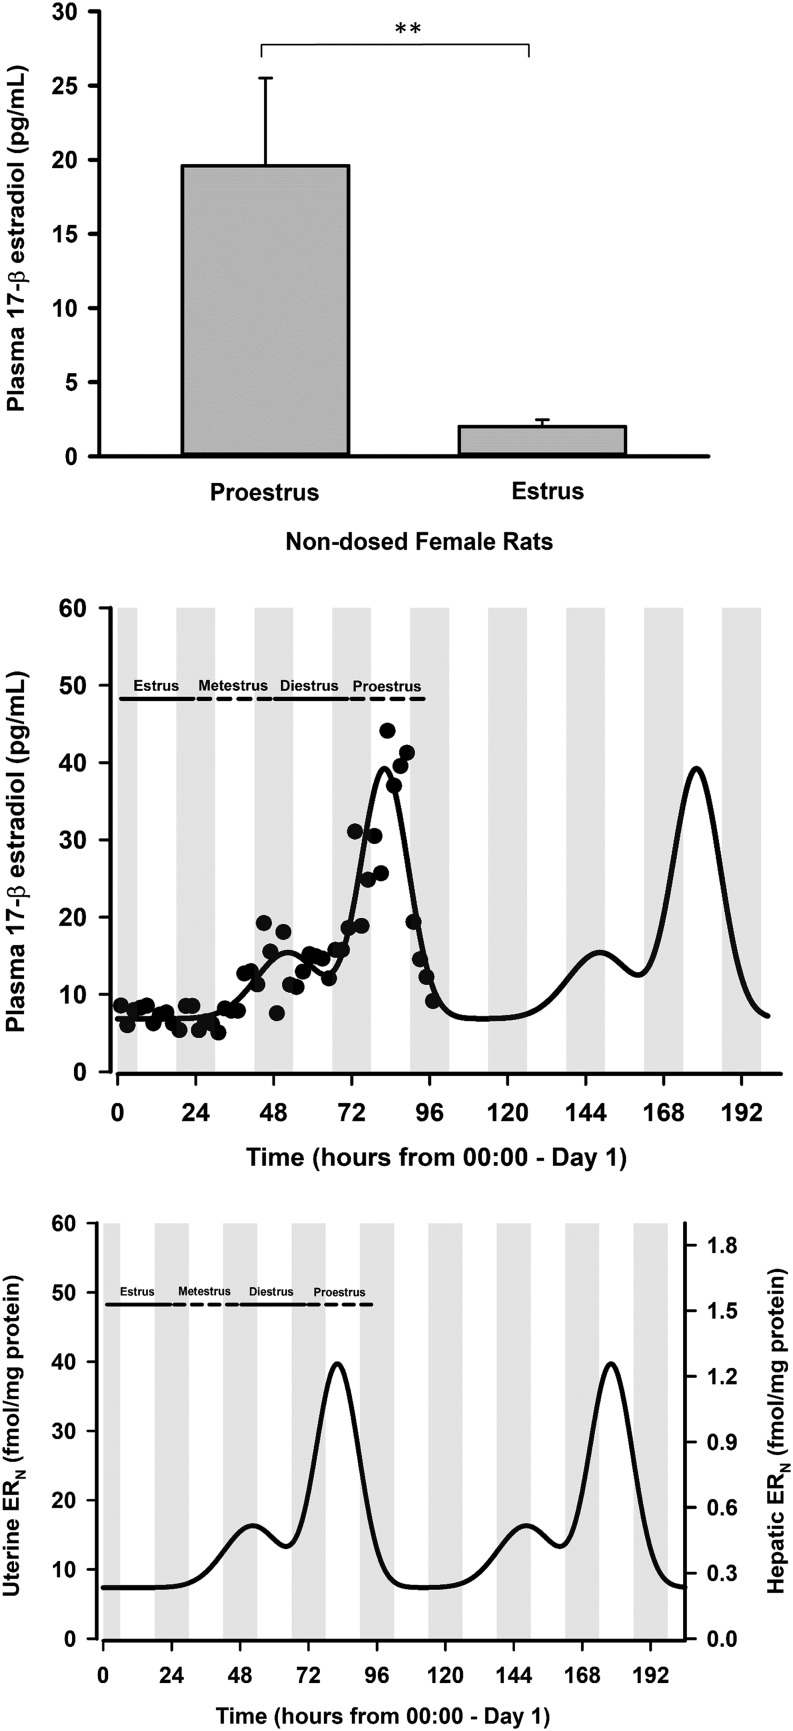
Top panel: Plasma 17β-estradiol (E2) concentrations in nondosed proestrus and estrus female rats in blood samples taken between 2 and 6 hour after lights on during each phase and determined using enzyme-linked immunosorbent assay. Error bars reflect 1 S.D. from the mean (n = 4 rats/group). **P < 0.001, significant difference. Middle panel: Plasma concentrations of E2 in female rats over the 4-day estrous cycle; symbols are measurements from individual rats [data taken from Smith et al. (1975)], and the solid line depicts the model-fitted profile (eq. 18) shown to repeat for a second cycle. Bottom panel: Simulated profile (eq. 20) of the estrogen complex in the nucleus (ERN) throughout the rodent estrous cycle in the uterus (left axis) and in liver (right axis). Parameter values are listed in Table 2.

