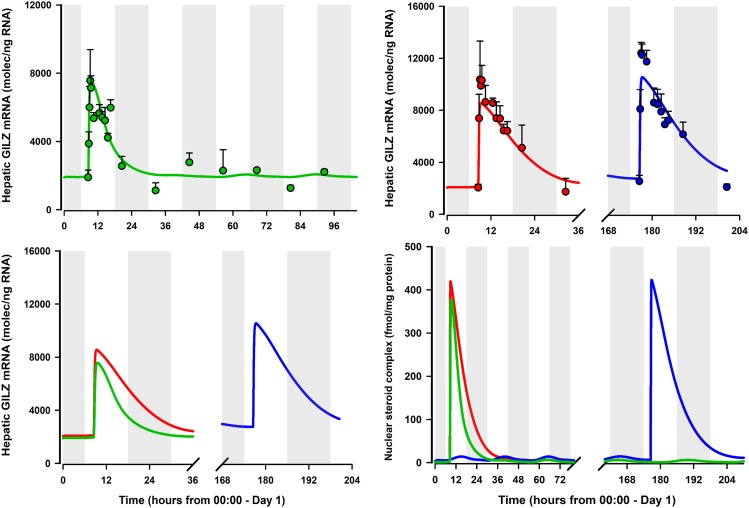
Fig. 6.
GILZ mRNA expression in liver from male rats (green; top left), estrus-phased female rats (red; top right), and proestrus-phased female rats (blue; top right) given 50 mg/kg IM MPL. Symbols represent the mean ± S.D., and the solid lines depict the model fit (eq. 21). Parameter values are listed in Table 3. Bottom right: Comparison of the model-fitted profiles of hepatic GILZ mRNA in the three groups. Bottom left: Comparison of the model-simulated profile of hepatic drug/hormone-receptor complex in the nucleus NRN_TOT (eq. 6) in the three groups. Dark (shaded) and light (unshaded) periods are indicated Table 4.

