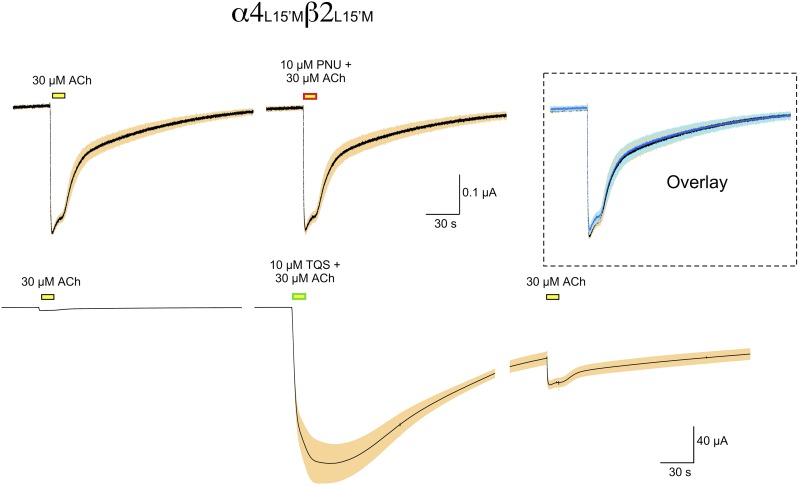
Fig. 2.
α4β2 Double mutant data. Averaged raw data traces (±S.E.M.) for α4β2 receptors with L15′M mutations in both subunits. Prior to averaging, the data from each cell were normalized to the peak amplitude of two initial 30 µM ACh control responses (see Materials and Methods). The average amplitude of the ACh controls was 325 ± 27 nA. The PNU-120596 data are the average of eight cells and the TQS data are the average of four cells. The inset in the upper panels is an overlay of the ACh controls and the responses to ACh plus 10 µM PNU-120596.

