Fig. 4.
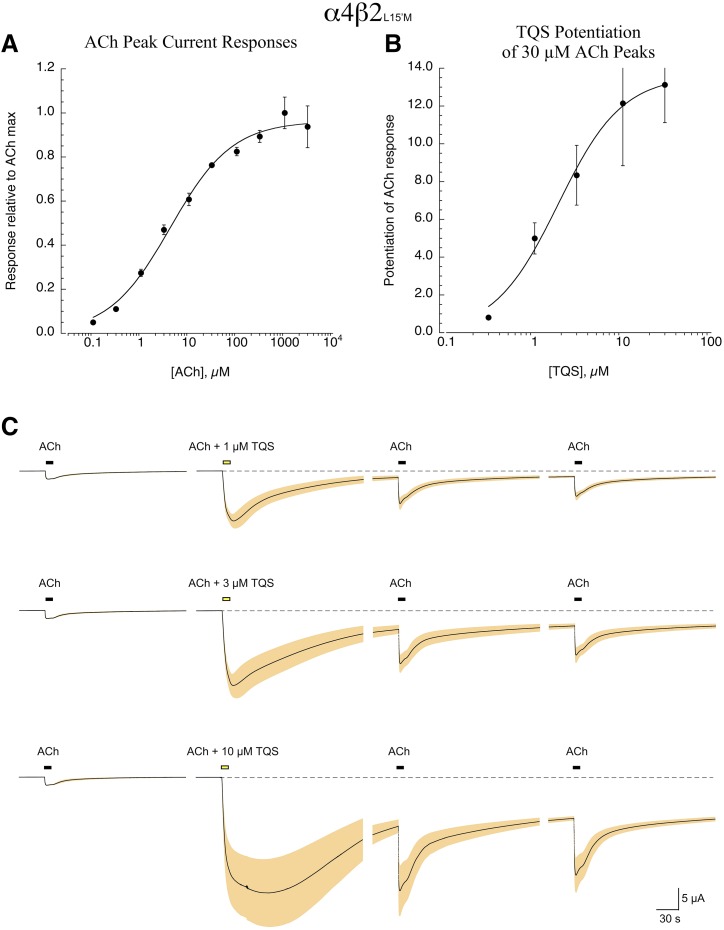
ACh and TQS responses of α4β2L15′M receptors. (A) The ACh concentration-response relationship of cells expressing wild-type α4 and β2L15′M subunits (n = 7). ACh was applied at progressively higher concentrations in alternation with repeated control applications of 30 µM ACh to ensure that there was no rundown or cumulative desensitization through the course of the experiment. Data were normalized to the ACh maximum response. As noted in the text, the data could be fit by either a one- or two-site model. The curve fit shown is for the one-site model that indicated a value of EC50 = 5.0 ± 0.6 µM. (B) The concentration-response relationship for TQS potentiation of ACh responses of cells expressing wild-type α4 and β2L15′M subunits; the data are the average peak current responses from four to seven cells at the varying concentrations, normalized to their respective ACh controls. Cells could only be exposed to single TQS applications, and at the highest concentration several cells failed voltage clamp. (C) Averaged raw data traces for TQS-potentiated responses up to 10 µM shown in (B), illustrating the protracted activation following single coapplications of ACh and TQS. Note that when ACh was applied again after the coapplication of 30 µM ACh and 30 µM TQS, all cells failed voltage clamp (data not shown).

